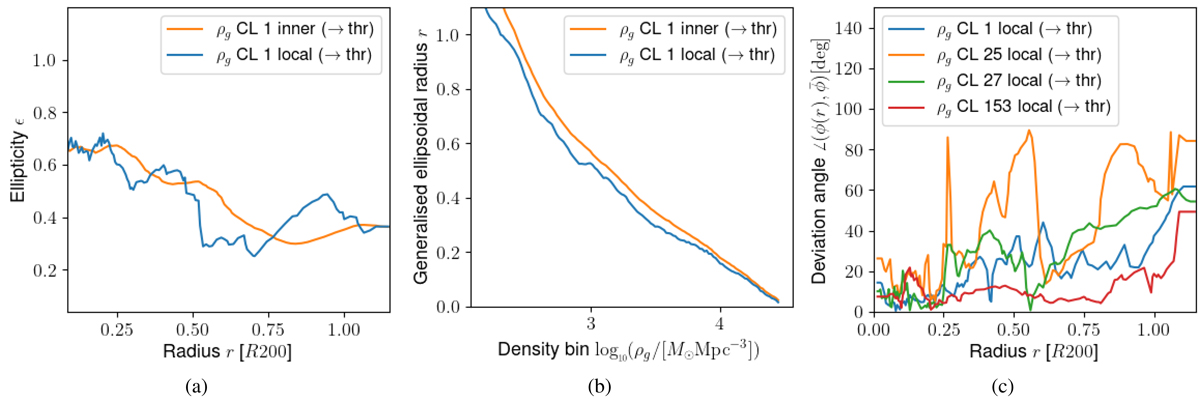
Fig. 6.
Download original image
Individual cluster result examples for ϵ(r), r(log10ρ), and Δϕ(r) for the gas density. Left panel: a comparison between inner and local domain for CL1 to illustrate the lagging effect mentioned in Sect. 3.1.1. Middle panel: fluctuation behaviour of the generalised ellipsoidal radius for the same cluster. Right panel: compares the variation in major axis orientation for various different clusters in one particular configuration (local) to highlight the individual fluctuation behaviour in orientation and its differences between the clusters. These figures are intended for illustration only, complementary to our statistical analysis using the full cluster sample. The clusters selected for these figures were picked using a random number generator. The labels ‘med’ and ‘thr’ have the same meaning as in Fig. 5.
Current usage metrics show cumulative count of Article Views (full-text article views including HTML views, PDF and ePub downloads, according to the available data) and Abstracts Views on Vision4Press platform.
Data correspond to usage on the plateform after 2015. The current usage metrics is available 48-96 hours after online publication and is updated daily on week days.
Initial download of the metrics may take a while.