Fig. 3.
Download original image
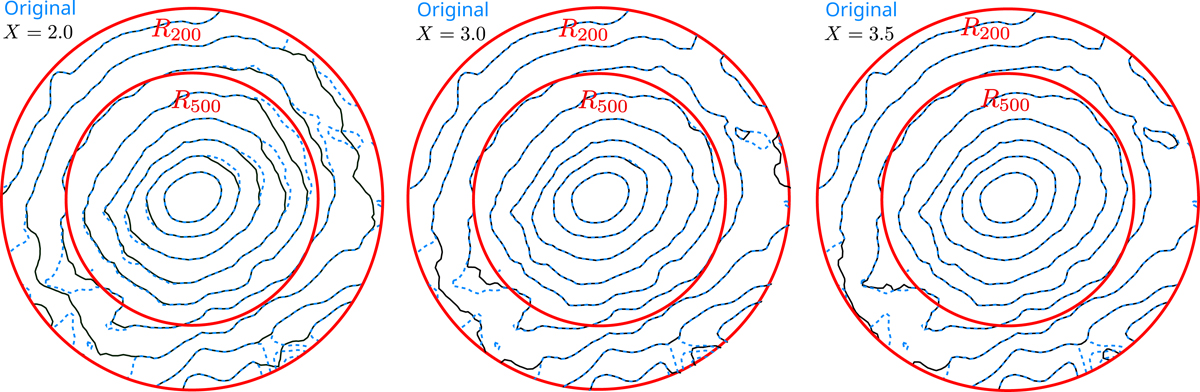
Illustration of the substructure–triaxiality degeneracy: the figure shows 2D projected gas density isocontours of the simulated, average-mass relaxed cluster CL85, which we have picked here because its major axis is almost perpendicular to the viewing direction. Black: density isocontours after substructure removal for different choices. Blue dashed: original isocontours. While X = 3.5 does not remove all substructures, the stricter choice X = 2 also removes ellipticity from contours in the bulk within r500.
Current usage metrics show cumulative count of Article Views (full-text article views including HTML views, PDF and ePub downloads, according to the available data) and Abstracts Views on Vision4Press platform.
Data correspond to usage on the plateform after 2015. The current usage metrics is available 48-96 hours after online publication and is updated daily on week days.
Initial download of the metrics may take a while.