Fig. 2.
Download original image
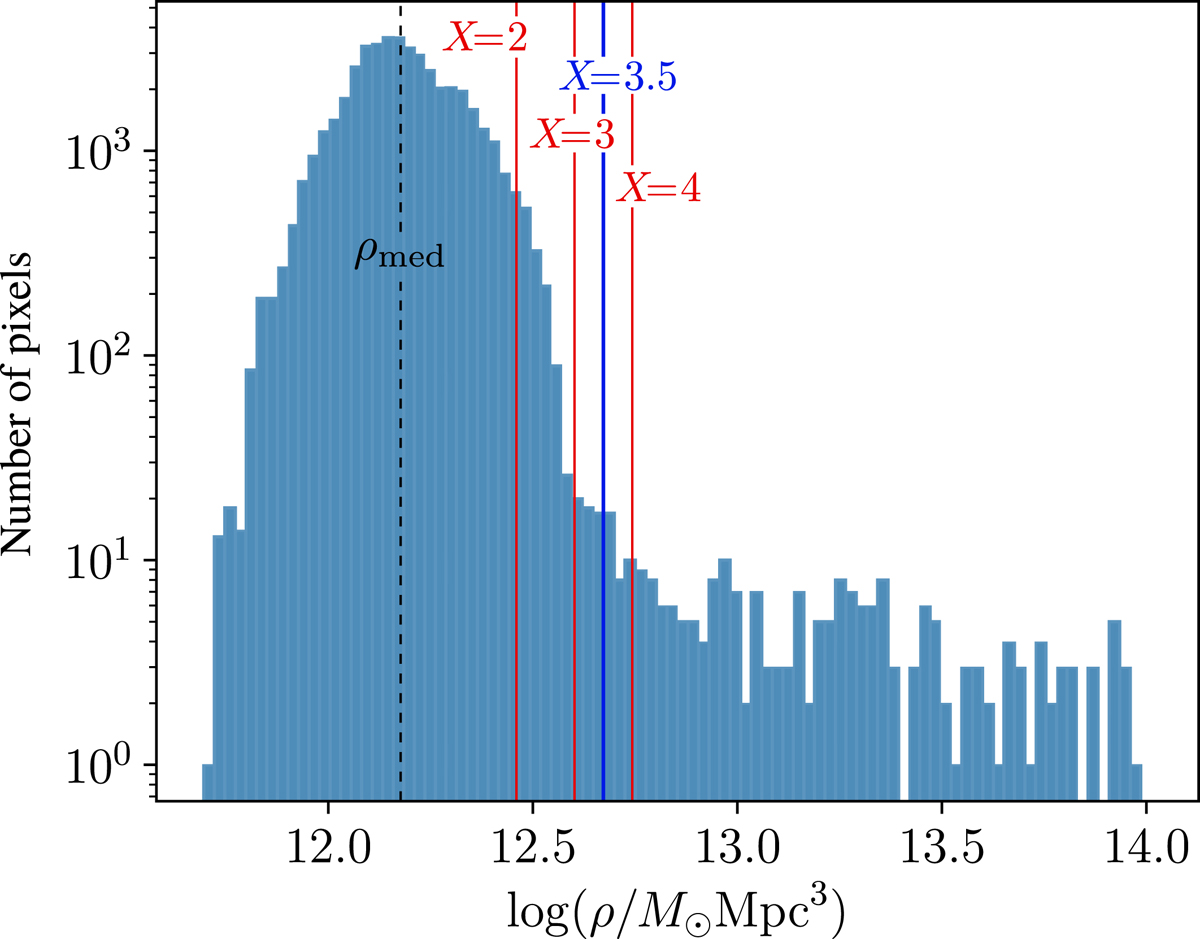
Illustration of the X-sigma method. Shown are gas density values of the relaxed cluster CL1 in an arbitrary, thin spherical shell of width Δr ≈ 11 kpc between r500 and r200 (this is an example choice for illustration only). The dashed line shows the median density, while the blue solid line shows the threshold for X = 3.5. The red solid lines show further arbitrary example choices (X = 2, 3, 4) to give an impression of the extent to which variations of order unity in X affect the distribution.
Current usage metrics show cumulative count of Article Views (full-text article views including HTML views, PDF and ePub downloads, according to the available data) and Abstracts Views on Vision4Press platform.
Data correspond to usage on the plateform after 2015. The current usage metrics is available 48-96 hours after online publication and is updated daily on week days.
Initial download of the metrics may take a while.