Fig. 8
Download original image
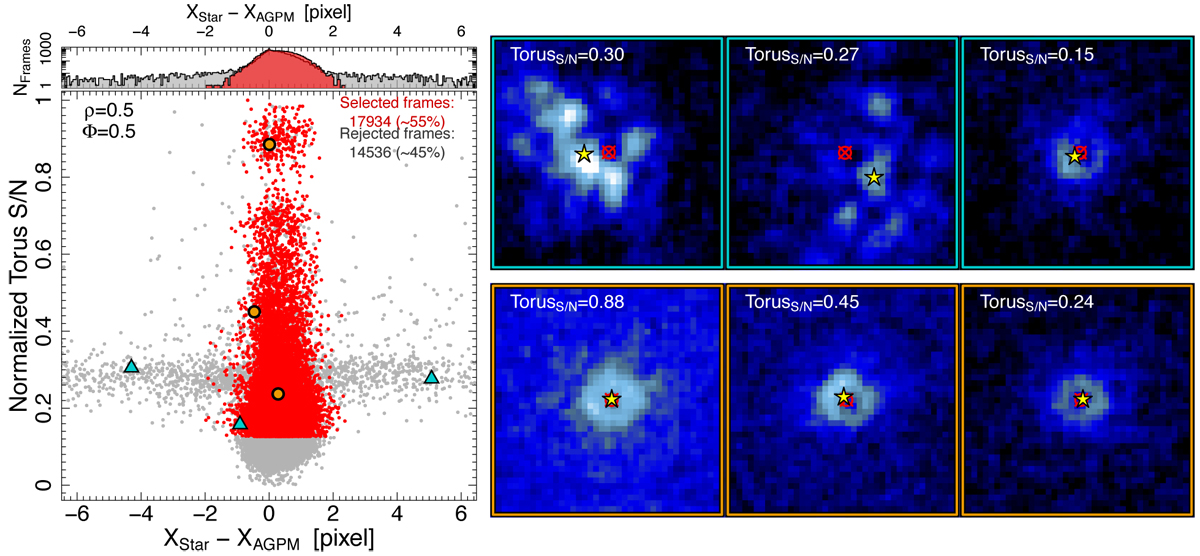
Examples of selected or rejected frames after applying our selection criteria. Left: normalized TorusS/N as a function of the difference between the positions of the star and the AGPM along the X-axis. The color-coding corresponds to the frame selected using ϕ = 0.5 and ρ = 0.5 (red dots) and rejected frames (gray dots). The orange circles correspond to three examples of frames selected and the cyan triangles to examples of rejected frames. The small panel at the top of shows the histogram of both distributions in logarithmic scale. Right: three examples of rejected frames (top row) and selected frames (bottom row). The red crossed circles correspond to the position of the AGPM, while the yellow star gives the derived position of the star obtained from the negative and positive 2D Gaussian fitting. The color scale is the same for all six images.
Current usage metrics show cumulative count of Article Views (full-text article views including HTML views, PDF and ePub downloads, according to the available data) and Abstracts Views on Vision4Press platform.
Data correspond to usage on the plateform after 2015. The current usage metrics is available 48-96 hours after online publication and is updated daily on week days.
Initial download of the metrics may take a while.