Fig. 6
Download original image
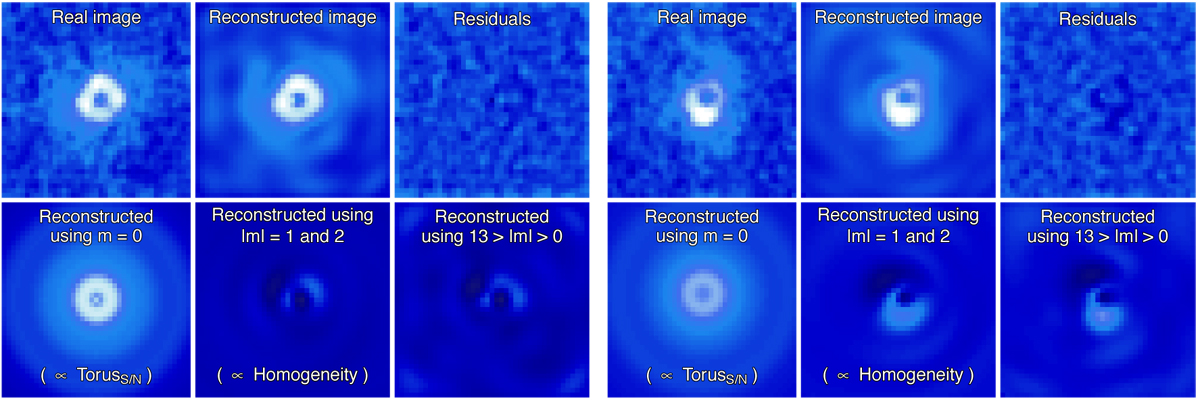
Two examples of reconstructed images using the pseudo-Zernike moments. For each panel (made up of six subpanels): top left: observations; top center: reconstructed image using m up to 12; top right: residuals of the modeling; bottom left: reconstruction of the image using only m = 0, related to radial and uniform azimuthal distribution; bottom center: reconstruction of the image using |m| = 1 and 2, corresponding to the adopted inhomogeneous contribution; bottom right: reconstruction of the image using 1 ≤ |m| ≤ 12, related to all the azimuthal contributions. For each subpanel the color scale is the same.
Current usage metrics show cumulative count of Article Views (full-text article views including HTML views, PDF and ePub downloads, according to the available data) and Abstracts Views on Vision4Press platform.
Data correspond to usage on the plateform after 2015. The current usage metrics is available 48-96 hours after online publication and is updated daily on week days.
Initial download of the metrics may take a while.