Fig. 5
Download original image
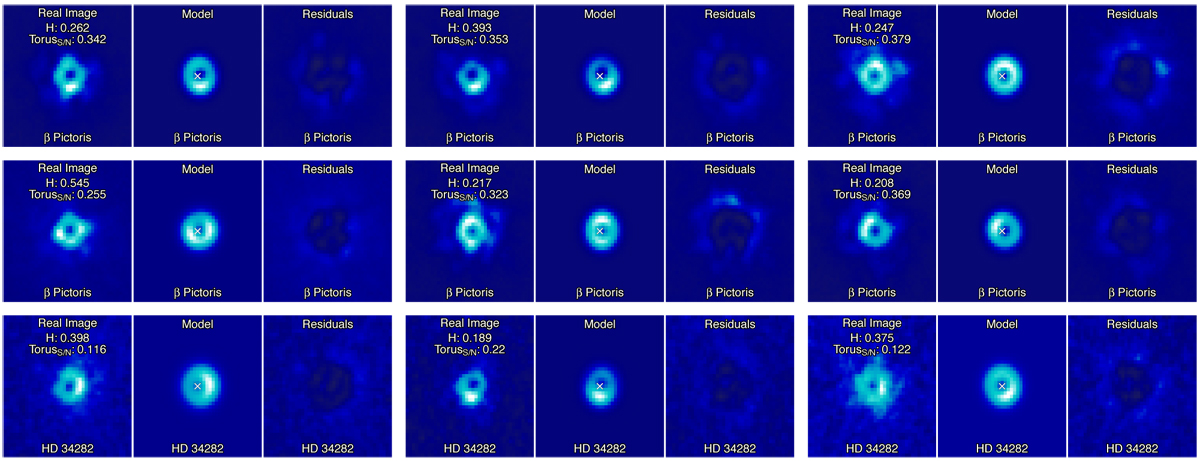
Modeling example of sky-subtracted science images for HD 34282 and β Pictoris using both the negative and positive 2D Gaussian. For each sub-panel, the observations are shown on the left, while the best-fit model is shown on the middle, and the residuals in the right. The homogeneity (H) and the S/N of the torus (TorusS/N) is labeled for each frame. The color scale is the same for each subpanel. The white cross for each center panel marks the location of the AGPM.
Current usage metrics show cumulative count of Article Views (full-text article views including HTML views, PDF and ePub downloads, according to the available data) and Abstracts Views on Vision4Press platform.
Data correspond to usage on the plateform after 2015. The current usage metrics is available 48-96 hours after online publication and is updated daily on week days.
Initial download of the metrics may take a while.