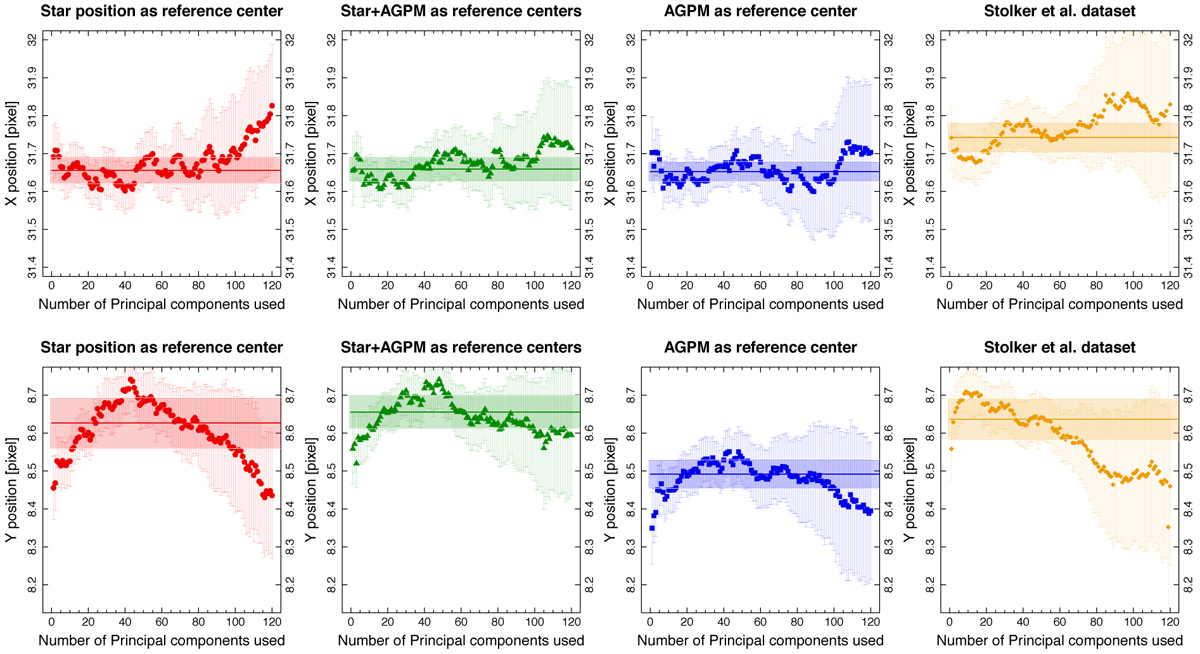
Fig. F.1
Download original image
Each panel shows the position for X (top panels) and Y (bottom panels) using our 2D Gaussian fitting for β Pictoris b. From left to right, the center used for our reduced data correspond to: only the star, the star and the AGPM, only the AGPM, and at the end the dataset from Stolker et al. (2019). The solid horizontal line corresponds to the weighted mean by the respective uncertainties (the vertical line in each solid point), with the respective associated uncertainty (colored horizontal area).
Current usage metrics show cumulative count of Article Views (full-text article views including HTML views, PDF and ePub downloads, according to the available data) and Abstracts Views on Vision4Press platform.
Data correspond to usage on the plateform after 2015. The current usage metrics is available 48-96 hours after online publication and is updated daily on week days.
Initial download of the metrics may take a while.