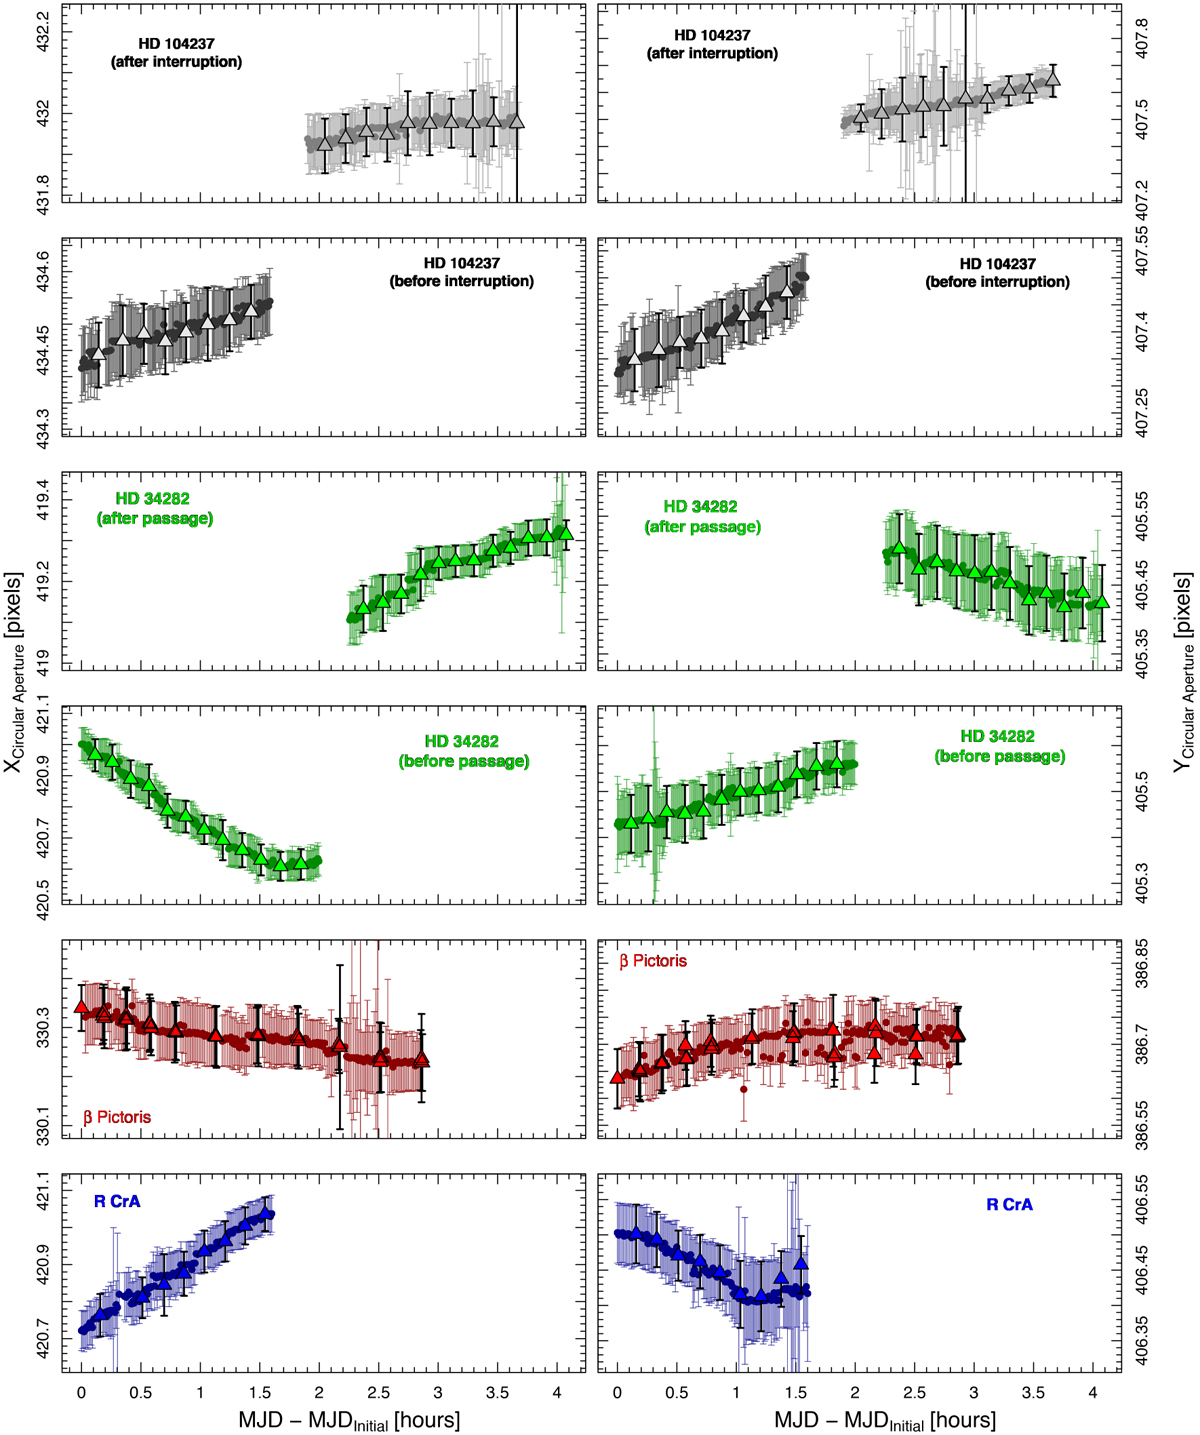
Fig. A.1
Download original image
Motion in time of the circular aperture for the four stars studied in this work. Left panel: Position of the center of the circular aperture along the X-axis as a function of time for all four targets. If the sequence was interrupted (because of an instrumental problem or zenith avoidance region), each sequence is plotted in a different panel. The error bars correspond to the 1σ uncertainties. The colored solid circles correspond to science frames and the colored solid triangles to the sky frames. Right panel: Same as the left panel, but for the Y-axis.
Current usage metrics show cumulative count of Article Views (full-text article views including HTML views, PDF and ePub downloads, according to the available data) and Abstracts Views on Vision4Press platform.
Data correspond to usage on the plateform after 2015. The current usage metrics is available 48-96 hours after online publication and is updated daily on week days.
Initial download of the metrics may take a while.