Fig. 16
Download original image
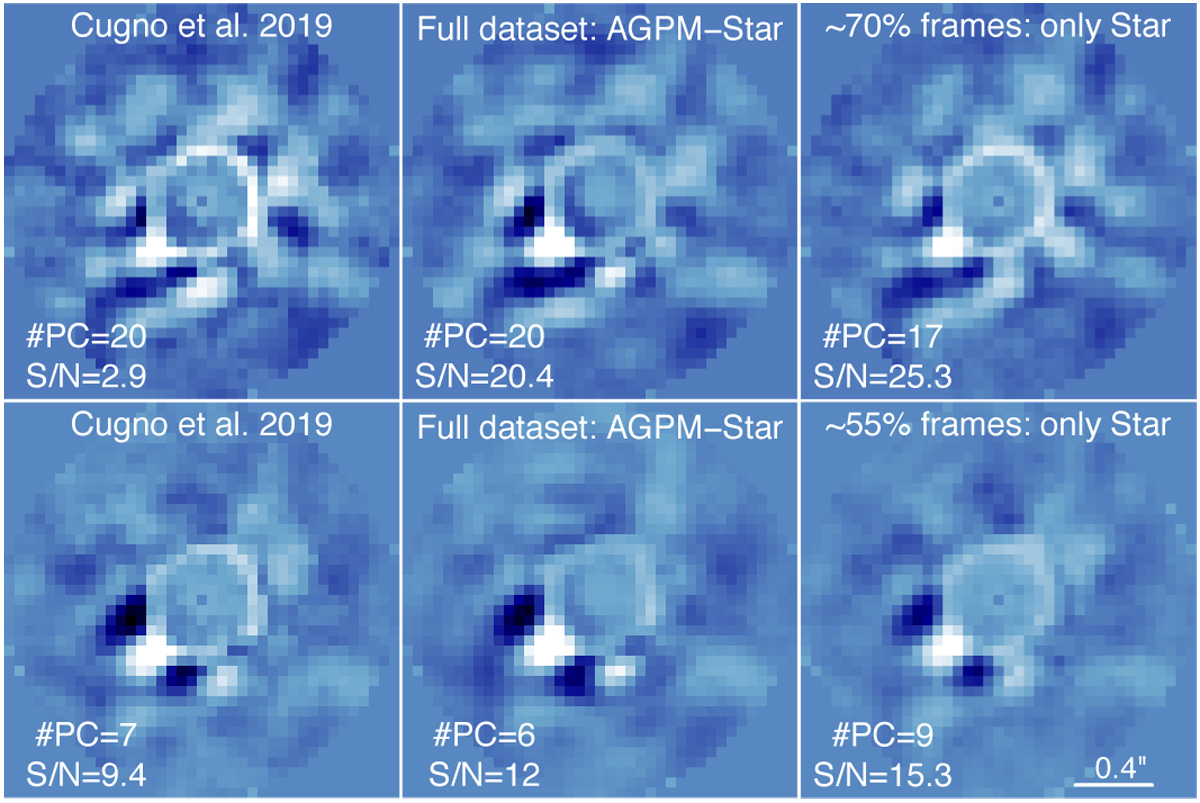
Final images with the highest S/N for R CrA b using different approaches for the data processing. Top row: images using principal components from 13 to 35. Bottom row. same as the top row but for principal components between 1 and 13. Shown are the best S/N for Cugno et al. (2019) (left), for the entire dataset using our centering approach with the combination of the AGPM and star positions (middle), and the frame selection using only the star position as reference center (right). The top and bottom rows have different color scales, but the subpanels in each row are consistent.
Current usage metrics show cumulative count of Article Views (full-text article views including HTML views, PDF and ePub downloads, according to the available data) and Abstracts Views on Vision4Press platform.
Data correspond to usage on the plateform after 2015. The current usage metrics is available 48-96 hours after online publication and is updated daily on week days.
Initial download of the metrics may take a while.