Fig. 12
Download original image
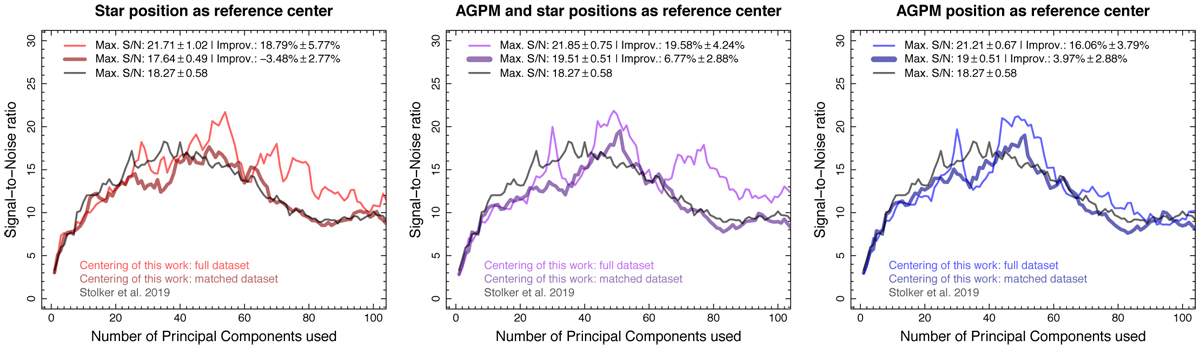
S/N of β Pictoris b as a function of the number of principal components used. The solid black line corresponds to the S/N from the data reduction presented in Stolker et al. (2019). The thin solid lines correspond to the full dataset, while the thick solid lines correspond to the same frames used in Stolker et al. (2019) (matched dataset), but both with our different centering options (depending on the panel). Left panel: frames are processed using the star position as the reference center for the full analysis. Middle panel: results when using the AGPM position for the principal component analysis and the star position for the derotation and stacking of the frames. Right panel: center is located at the position of the AGPM for the full analysis.
Current usage metrics show cumulative count of Article Views (full-text article views including HTML views, PDF and ePub downloads, according to the available data) and Abstracts Views on Vision4Press platform.
Data correspond to usage on the plateform after 2015. The current usage metrics is available 48-96 hours after online publication and is updated daily on week days.
Initial download of the metrics may take a while.