Fig. 11
Download original image
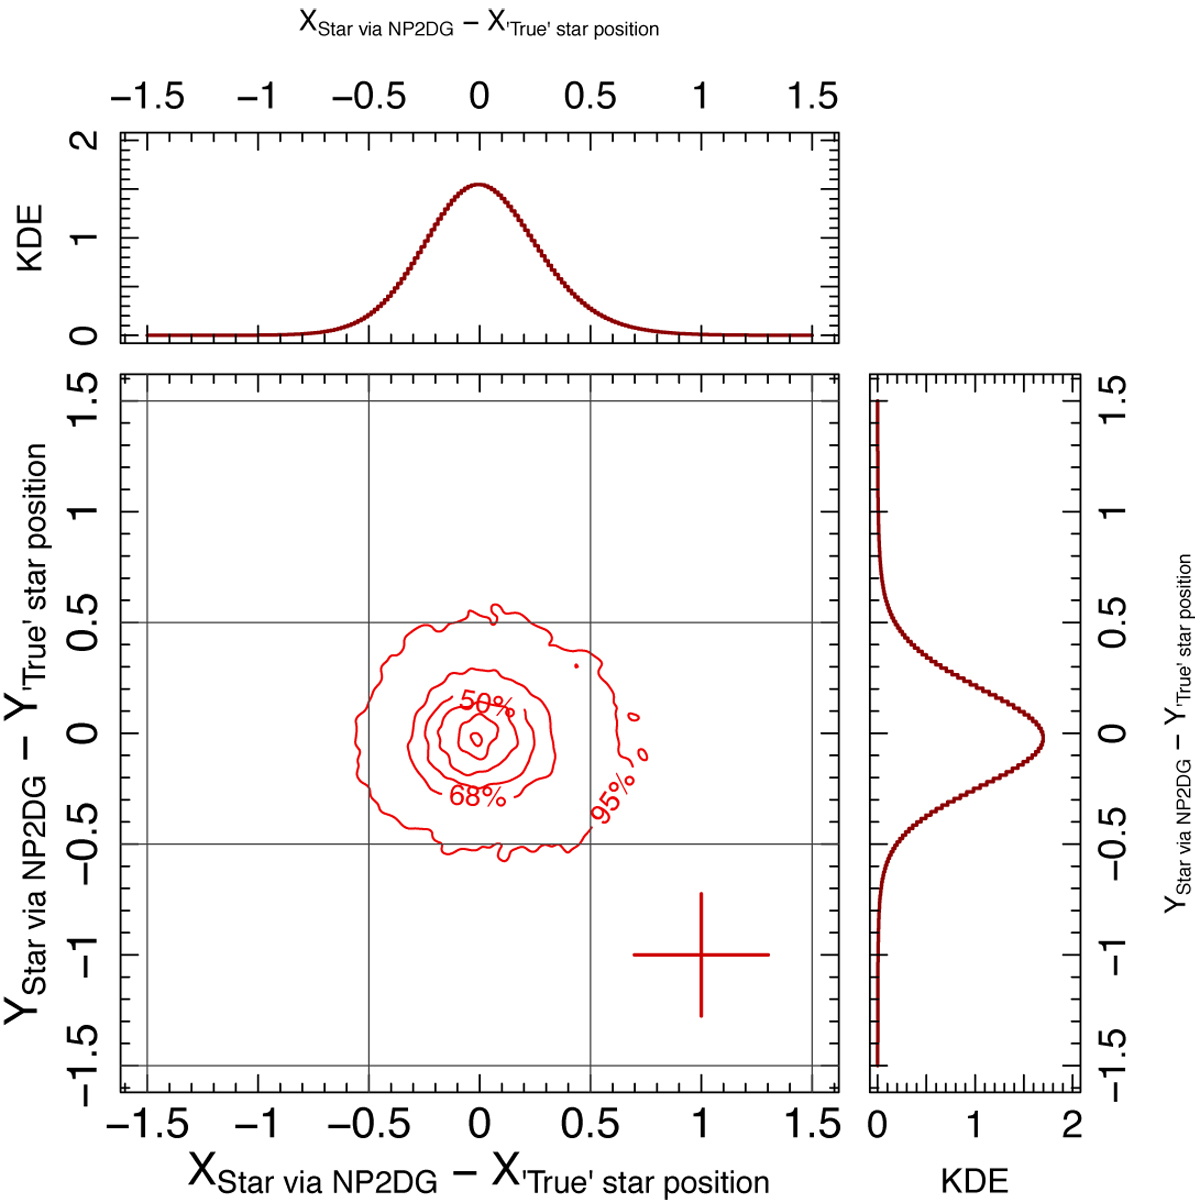
Comparison of the star positions derived from the close companion and those obtained by our fitting approach (negative and positive 2D Gaussian fitting labeled NP2DG in the figure). The small top and side panels show the kernel density estimators (KDE) for the X- and Y-axes, respectively. The grid represent pixels, and the colored cross corresponds to the typical uncertainty. The contour lines enclose the areas containing 95.5, 68.5, 50, 30, 10, and 1% of the sample with respect to the maximum of the distribution.
Current usage metrics show cumulative count of Article Views (full-text article views including HTML views, PDF and ePub downloads, according to the available data) and Abstracts Views on Vision4Press platform.
Data correspond to usage on the plateform after 2015. The current usage metrics is available 48-96 hours after online publication and is updated daily on week days.
Initial download of the metrics may take a while.