Fig. 10
Download original image
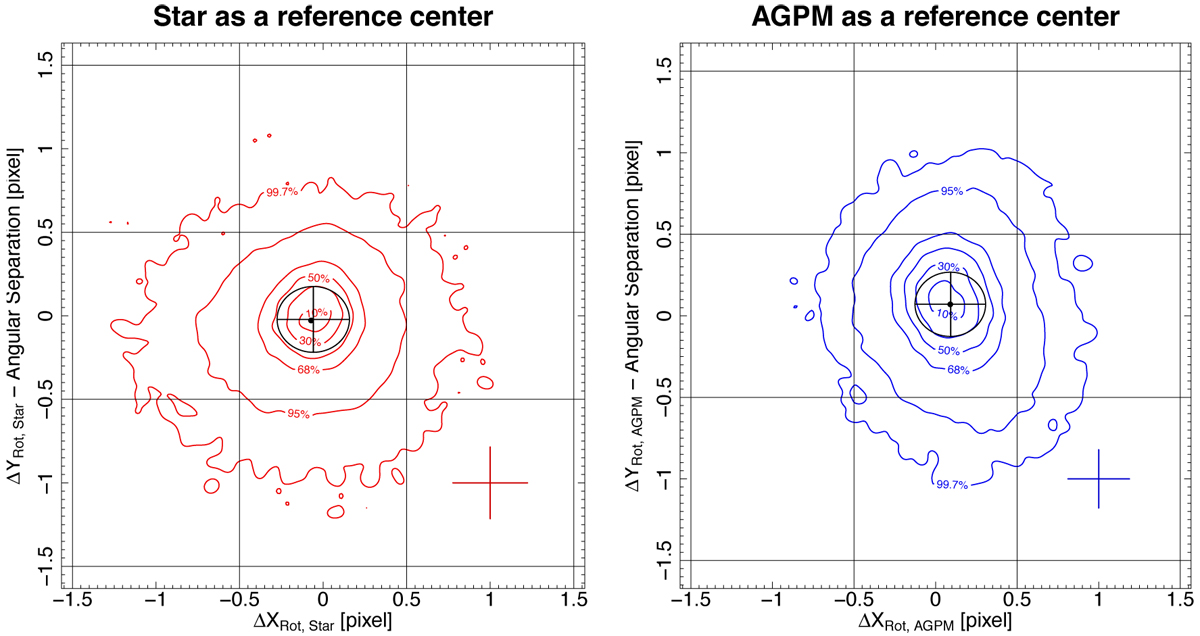
Density contours of the position of the close companion after derotating each frame by the parallactic angle and the position angle of the companion, and after subtracting its angular separation. The derotation is either done at the position of the star inferred from our modeling (left) or at the position of the AGPM (right). The black circle corresponds to the uncertainties on the angular separation and the position angle of the companion at the peak of the distribution. The grid shown in each panel represent pixels, and the colored crosses correspond to the typical uncertainty. The contour lines in each panel enclose the areas containing 99.7, 95.5, 68.5, 50, 30, and 10% of the sample with respect to the maximum of the distribution.
Current usage metrics show cumulative count of Article Views (full-text article views including HTML views, PDF and ePub downloads, according to the available data) and Abstracts Views on Vision4Press platform.
Data correspond to usage on the plateform after 2015. The current usage metrics is available 48-96 hours after online publication and is updated daily on week days.
Initial download of the metrics may take a while.