Fig. 7.
Download original image
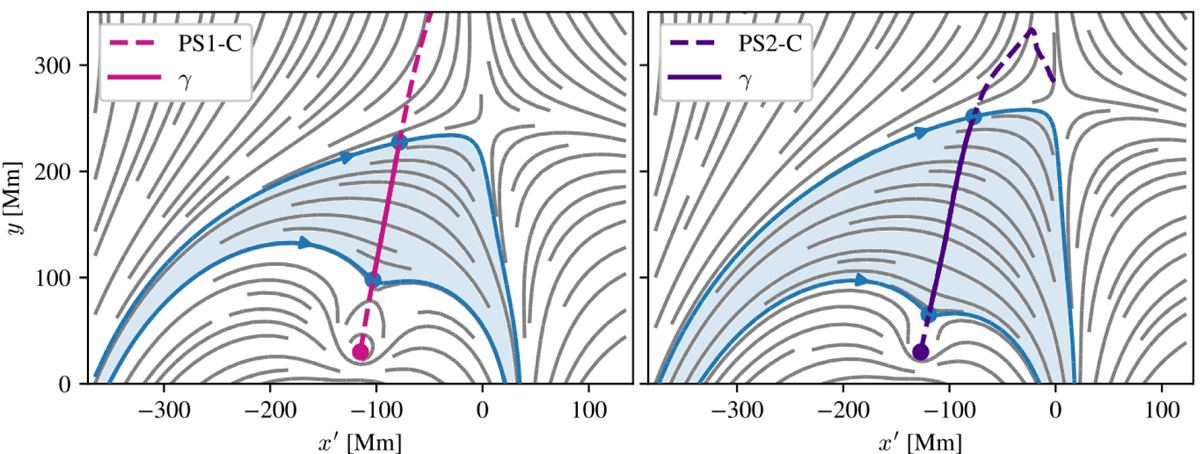
Magnetic field lines for events PS1-C (left) and PS2-C (right). The shaded light blue areas represent the magnetic cage above the FR, and the magenta and indigo dots indicate the initial position for PS1-C and PS2-C, respectively. The solid line represents the internal trajectory of the FR through which the flux of the magnetic cage is quantified.
Current usage metrics show cumulative count of Article Views (full-text article views including HTML views, PDF and ePub downloads, according to the available data) and Abstracts Views on Vision4Press platform.
Data correspond to usage on the plateform after 2015. The current usage metrics is available 48-96 hours after online publication and is updated daily on week days.
Initial download of the metrics may take a while.