Fig. 2.
Download original image
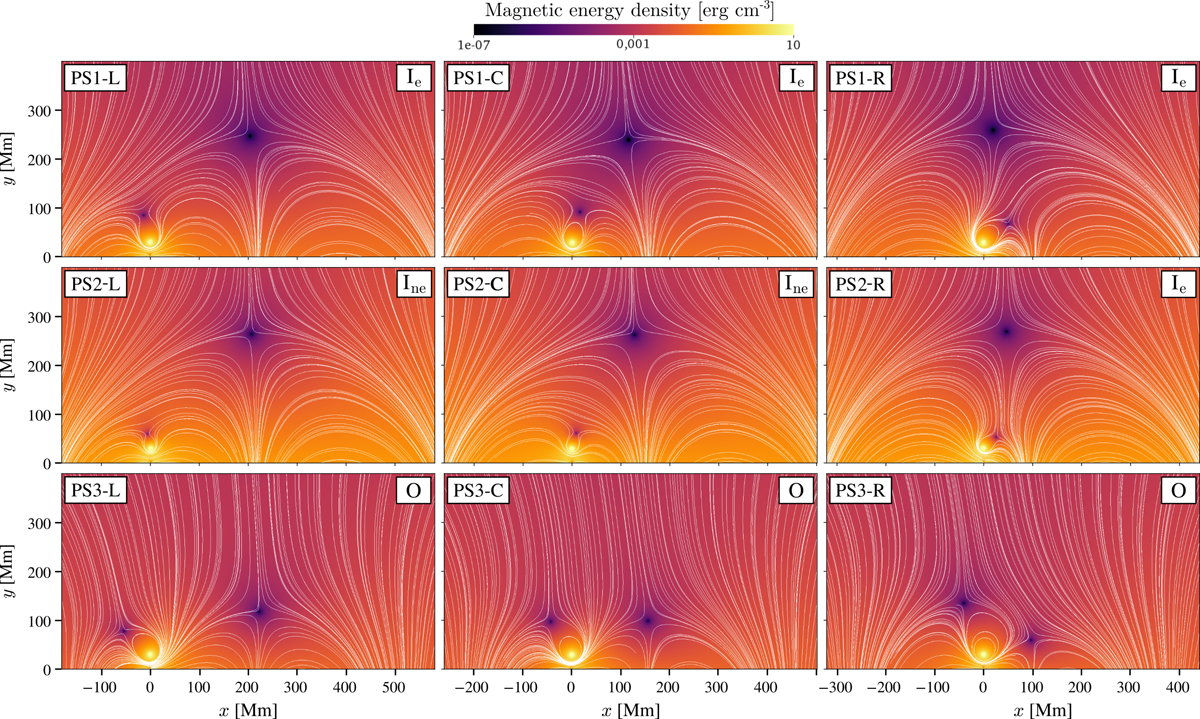
Initial scenarios for the simulations listed in Table 1. The case name and the class of interaction are indicated in boxes to the left and right of each panel, respectively. The colour represents the magnetic energy density, with high density in light yellow and null points shown in dark purple. The magnetic field lines are drawn in white.
Current usage metrics show cumulative count of Article Views (full-text article views including HTML views, PDF and ePub downloads, according to the available data) and Abstracts Views on Vision4Press platform.
Data correspond to usage on the plateform after 2015. The current usage metrics is available 48-96 hours after online publication and is updated daily on week days.
Initial download of the metrics may take a while.