Open Access
Fig. 11.
Download original image
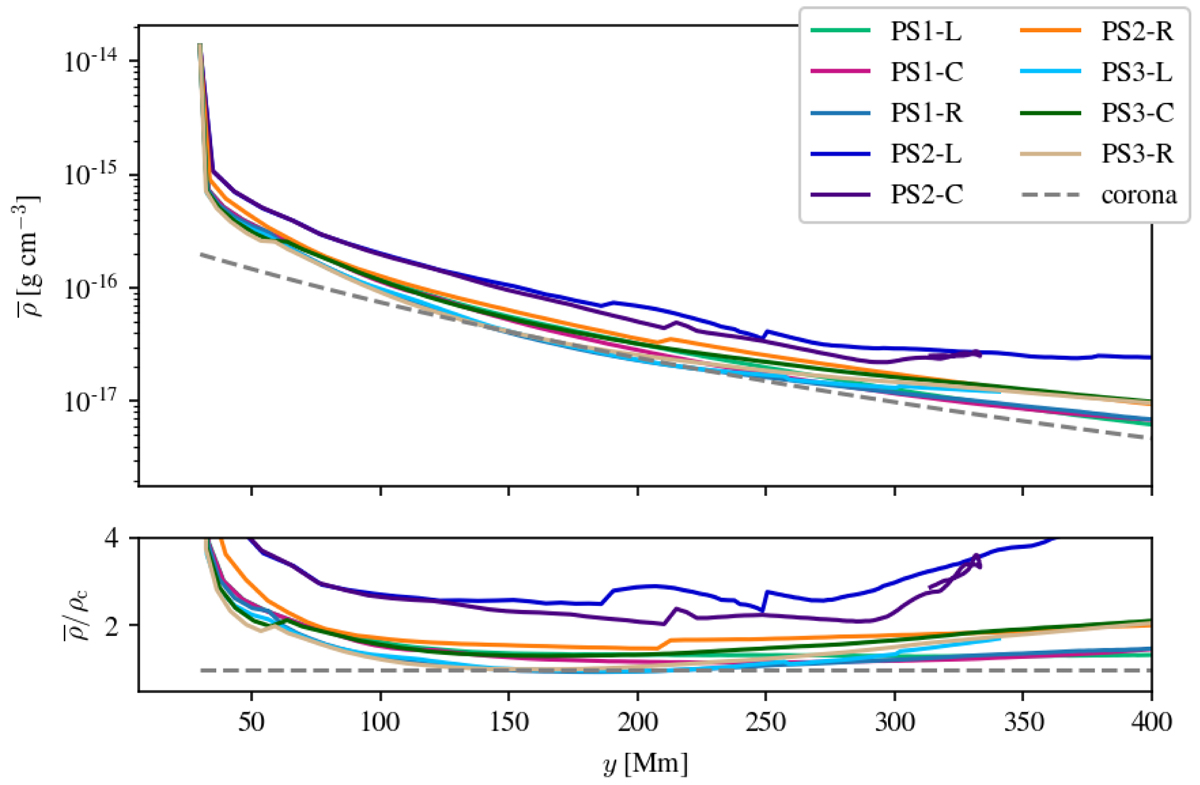
Average plasma density of the FR as a function of height. The dashed grey line represents the plasma density of the corona. The lower panel shows the corresponding ratio between the plasma density for each case and the coronal plasma density ρc.
Current usage metrics show cumulative count of Article Views (full-text article views including HTML views, PDF and ePub downloads, according to the available data) and Abstracts Views on Vision4Press platform.
Data correspond to usage on the plateform after 2015. The current usage metrics is available 48-96 hours after online publication and is updated daily on week days.
Initial download of the metrics may take a while.