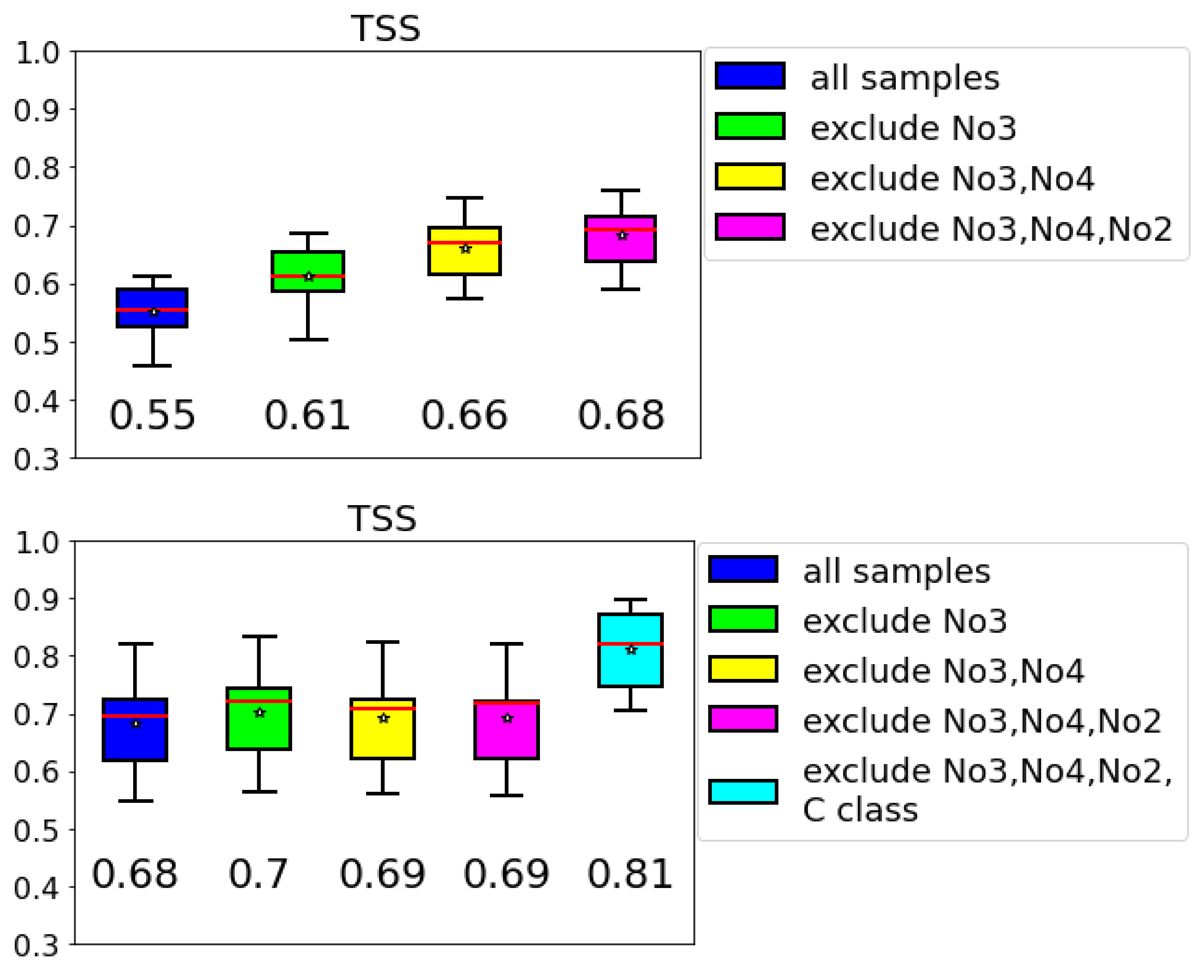
Fig. 5.
Download original image
Boxplots of TSS values computed on 10 test sets for the prediction of C1+ class flares (top panel) and M1+ class flares (bottom panel) by successively excluding data samples of different classes from the test sets. Top panel. From left to right: (1) all classes are present in the test sets; (2) NO3 samples are excluded from the test sets; (3) NO3 and NO4 samples are excluded from the test sets; (4) NO3, NO4, and NO2 samples are excluded from the test sets. Bottom panel. From left to right: (1) all classes are present in the test sets; (2) NO3 samples are excluded from the test sets; (3) NO3 and NO4 samples are excluded from the test sets; (4) NO3, NO4, and NO2 samples are excluded from the test sets; (5) NO3, NO4, NO2, and C class samples are excluded from the test sets.
Current usage metrics show cumulative count of Article Views (full-text article views including HTML views, PDF and ePub downloads, according to the available data) and Abstracts Views on Vision4Press platform.
Data correspond to usage on the plateform after 2015. The current usage metrics is available 48-96 hours after online publication and is updated daily on week days.
Initial download of the metrics may take a while.