Open Access
Fig. 4.
Download original image
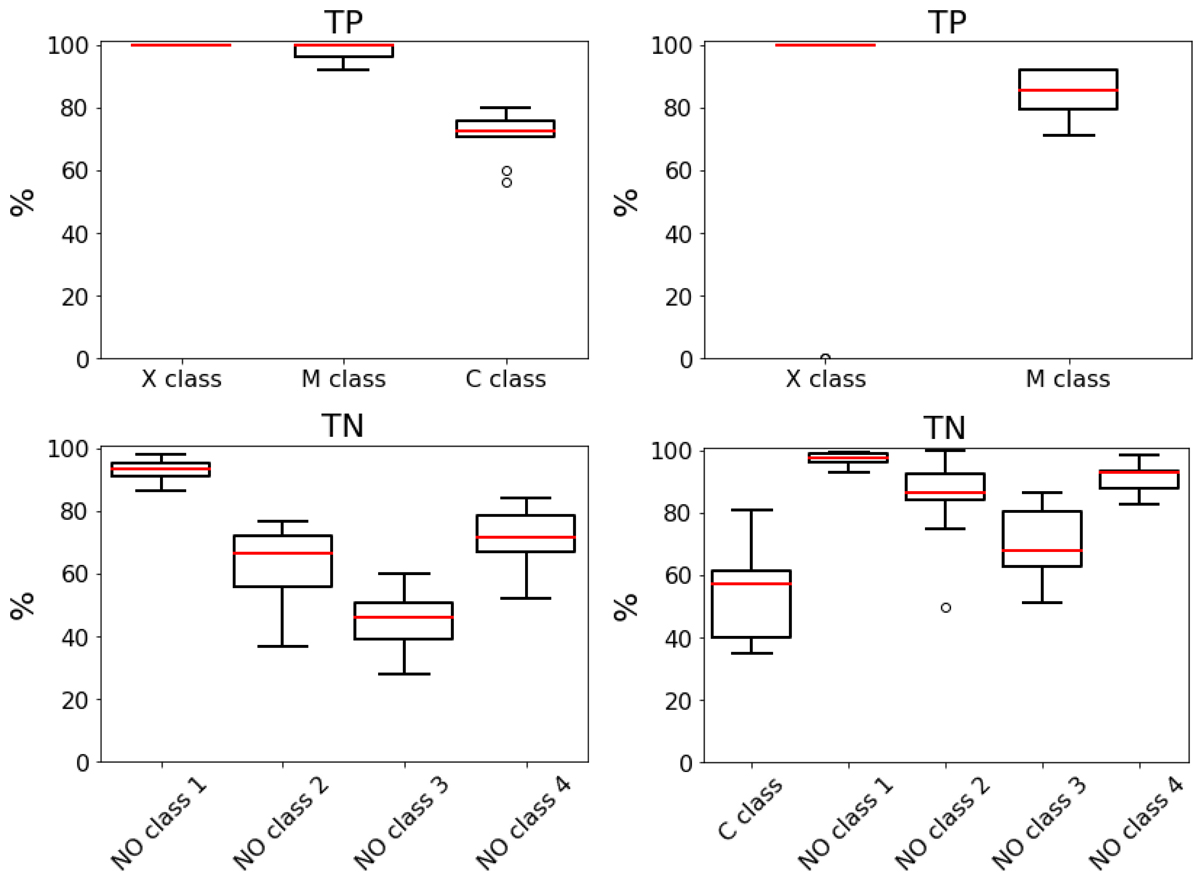
Boxplots of the percentages of correctly predicted samples in the10 test sets for the C1+ flares prediction (first column) and for the M1+ flares prediction (second column). The rates of the TPs and the rates of the TNs are shown in the top and bottom panels, respectively.
Current usage metrics show cumulative count of Article Views (full-text article views including HTML views, PDF and ePub downloads, according to the available data) and Abstracts Views on Vision4Press platform.
Data correspond to usage on the plateform after 2015. The current usage metrics is available 48-96 hours after online publication and is updated daily on week days.
Initial download of the metrics may take a while.