Open Access
Fig. B.3
Download original image
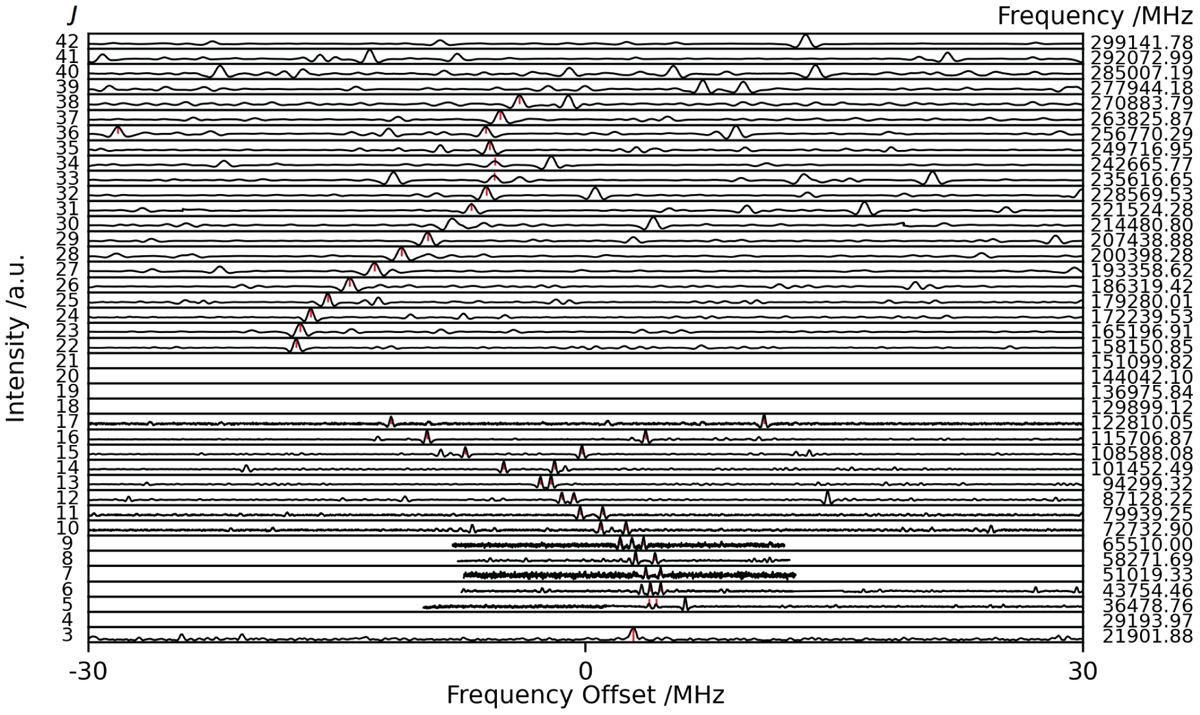
Loomis-Wood plot around the assigned qR0 series transitions in the W-band region of the Ag conformer, which are shown by red sticks.
Current usage metrics show cumulative count of Article Views (full-text article views including HTML views, PDF and ePub downloads, according to the available data) and Abstracts Views on Vision4Press platform.
Data correspond to usage on the plateform after 2015. The current usage metrics is available 48-96 hours after online publication and is updated daily on week days.
Initial download of the metrics may take a while.