Fig. B.2
Download original image
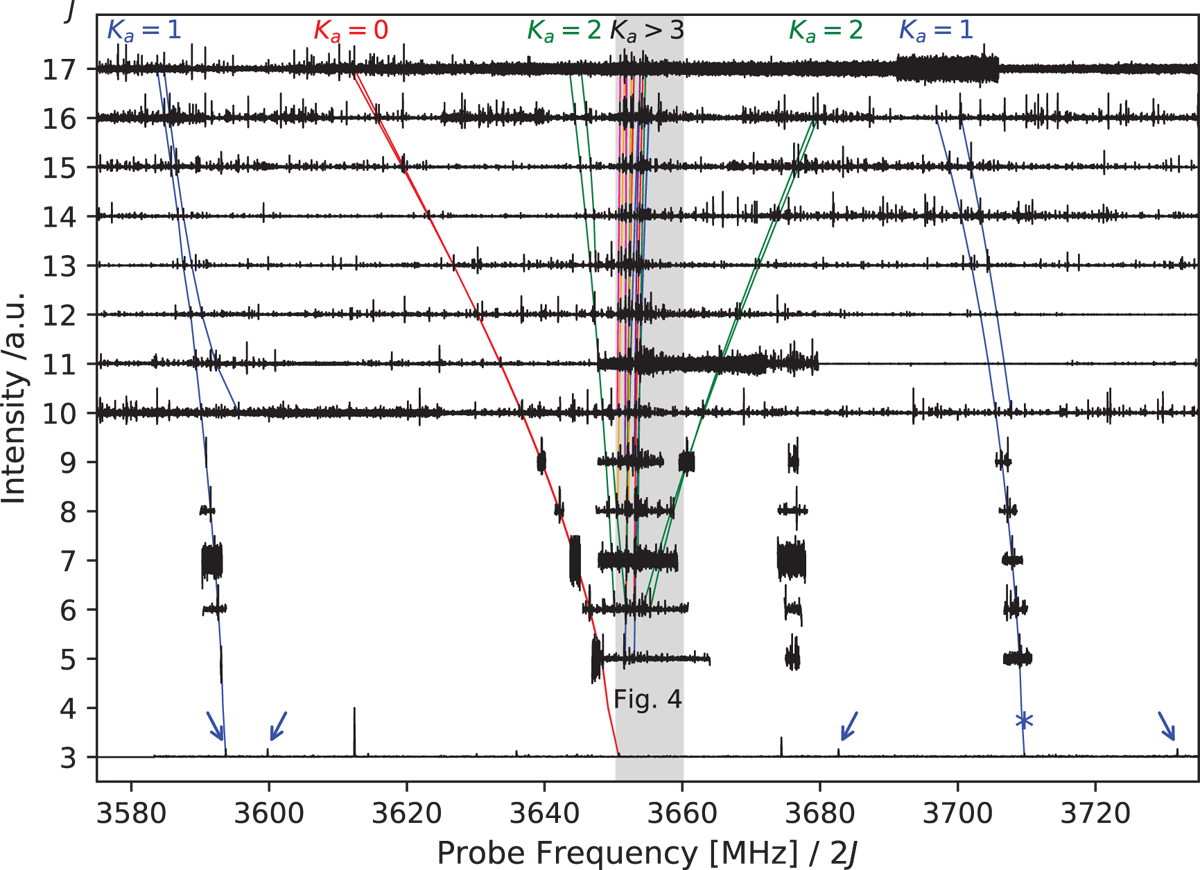
Fortrat diagram of n-propanol. The colored lines in the Fortrat diagram mark linkages of ![]() series transitions of Ag n-propanol,
series transitions of Ag n-propanol, ![]() - DM-DR spectroscopy secured assignments in the W-band region (from J = 10 to J = 16). Tentative assignments of Κa = 1 transitions derived from the CP-FTMW measurement (Fig. B.1) are marked by the blue arrows. Considering found qR1 series, another candidate transition is marked by the blue asterisk. A quantum mechanical model with experimental accuracy can solve the ambiguity of these tentative assignments. The gray area depicts the region of the Fortrat diagram in Fig. 4.
- DM-DR spectroscopy secured assignments in the W-band region (from J = 10 to J = 16). Tentative assignments of Κa = 1 transitions derived from the CP-FTMW measurement (Fig. B.1) are marked by the blue arrows. Considering found qR1 series, another candidate transition is marked by the blue asterisk. A quantum mechanical model with experimental accuracy can solve the ambiguity of these tentative assignments. The gray area depicts the region of the Fortrat diagram in Fig. 4.
Current usage metrics show cumulative count of Article Views (full-text article views including HTML views, PDF and ePub downloads, according to the available data) and Abstracts Views on Vision4Press platform.
Data correspond to usage on the plateform after 2015. The current usage metrics is available 48-96 hours after online publication and is updated daily on week days.
Initial download of the metrics may take a while.