Fig. 4
Download original image
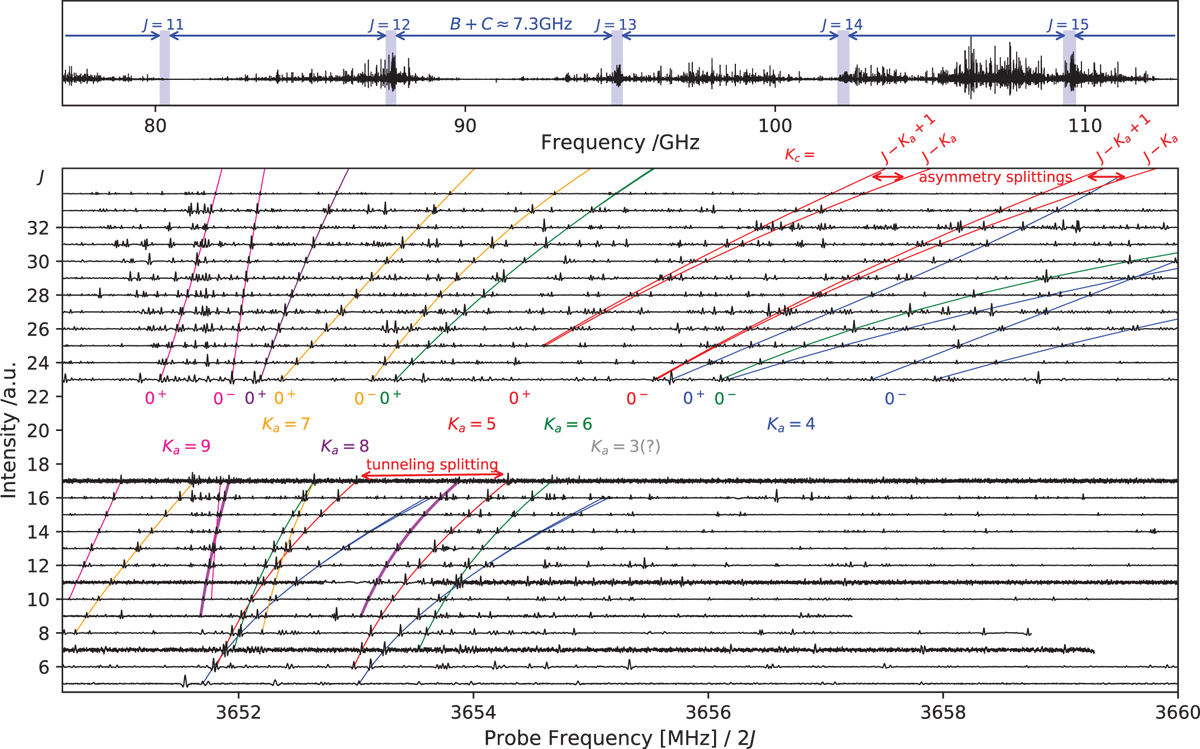
Fortrat diagram of n-propanol. Top panel: a broadband measurement in the W-band region is shown, where respective regions with signatures of the Ag conformer, leading to the Fortrat diagram, are highlighted. In some regions, the spectrometer is not as sensitive, e.g. around J=11, compared to others. Bottom panel: The colored lines in the Fortrat diagram mark linkages of ![]() series transitions,
series transitions, ![]() . DM-DR spectroscopy secured assignments in the W-band region (from J = 10 to J = 16). The existence of two tunneling states is proven as for each Ka partner series are found; the tunneling states are marked by 0+ and 0−. More series can be found, but are not assigned yet, e.g. QR3 ones. We note the larger tunneling splitting of QR6 series (green lines), e.g., in comparison to QR5 ones, and the different slopes for QRS series (thick purple lines).
. DM-DR spectroscopy secured assignments in the W-band region (from J = 10 to J = 16). The existence of two tunneling states is proven as for each Ka partner series are found; the tunneling states are marked by 0+ and 0−. More series can be found, but are not assigned yet, e.g. QR3 ones. We note the larger tunneling splitting of QR6 series (green lines), e.g., in comparison to QR5 ones, and the different slopes for QRS series (thick purple lines).
Current usage metrics show cumulative count of Article Views (full-text article views including HTML views, PDF and ePub downloads, according to the available data) and Abstracts Views on Vision4Press platform.
Data correspond to usage on the plateform after 2015. The current usage metrics is available 48-96 hours after online publication and is updated daily on week days.
Initial download of the metrics may take a while.