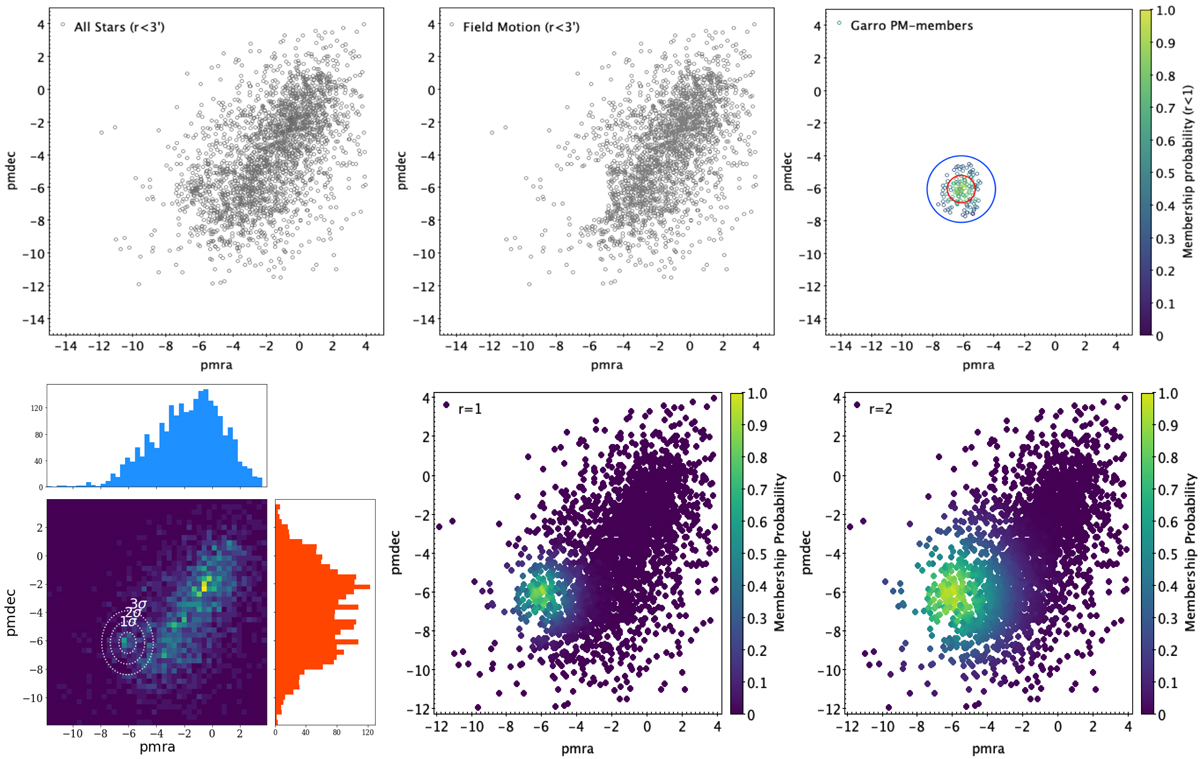
Fig. 4.
Download original image
Top: VPM diagram for all star sample (left panel), field sample (middle panel), and Garro 02 PM members (right panel). In the right panel, the blue and red circles indicate a radius within 2 and 1 mas yr−1, respectively. As it is possible to see, we selected the most probable members (> 50%) within 1 mas yr−1 from the mean cluster PMs. Bottom.Left panel: VPM diagram for Garro 02 cluster as a 2D histogram, displaying both the PMRA (in blue) and PMDEC (in red) histograms separately. The yellow and light green colours depict over-densities, whereas the dark green and blue colours represent lower densities. We indicate with dotted white circles the 1σ, 2σ, and 3σ centred on the mean cluster PMs. Middle and right panels: VPM diagrams, where the brightest cloud represents the highest PM probability, within a radius r < 1 mas yr−1 and r < 2 mas yr−1.
Current usage metrics show cumulative count of Article Views (full-text article views including HTML views, PDF and ePub downloads, according to the available data) and Abstracts Views on Vision4Press platform.
Data correspond to usage on the plateform after 2015. The current usage metrics is available 48-96 hours after online publication and is updated daily on week days.
Initial download of the metrics may take a while.