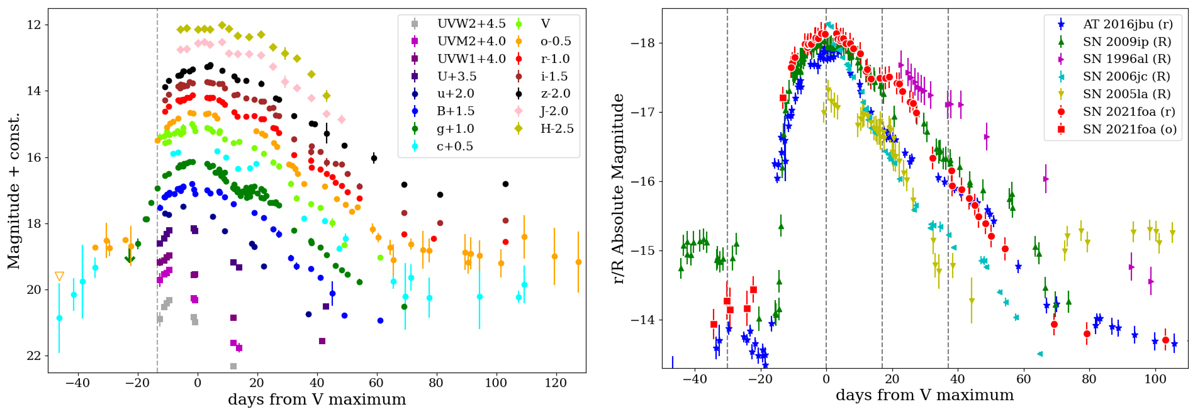
Fig. 1.
Download original image
Light curves of SN 2021foa. Left: UV, optical, and NIR light curves of SN 2021foa, covering 6 months of observations. The phases are relative to the V-band maximum. The pre-discovery detections are also reported. The discovery epoch is marked with a vertical line. Right: comparison of the r-band absolute light curves of SN 2021foa, AT 2016jbu, and SN 2009ip (R-band). The error bars include the uncertainties on the photometric measurements, the distance, and the reddening in quadrature. The vertical lines mark the significant phases: ‘Event A’, ‘Event B’, the ‘plateau’, and the ‘knee’. The ATLAS pre-discovery orange-band detections of SN 2021foa are also shown with square symbols to point out its Event A. The R-band absolute light curves of the Type IIn SN 1996al, the Type Ibn SN 2006jc, and the transitional IIn/Ibn SN 2005la are also plotted.
Current usage metrics show cumulative count of Article Views (full-text article views including HTML views, PDF and ePub downloads, according to the available data) and Abstracts Views on Vision4Press platform.
Data correspond to usage on the plateform after 2015. The current usage metrics is available 48-96 hours after online publication and is updated daily on week days.
Initial download of the metrics may take a while.