Fig. 6
Download original image
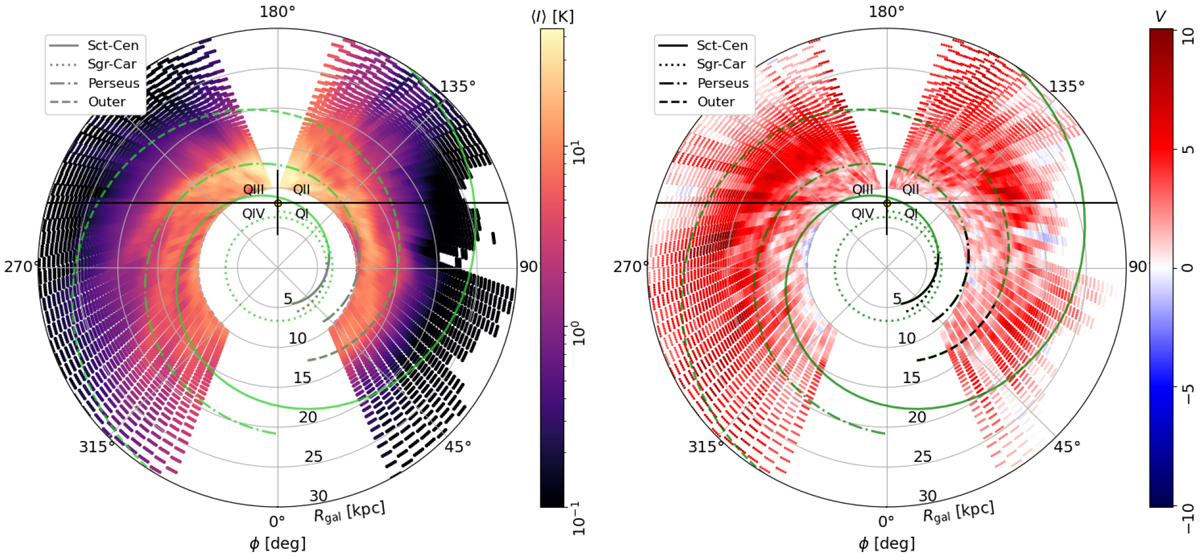
Face-on view of the mean H I emission intensity (〈I〉; left) and the filament orientation quantified by the projected Rayleigh statistic (V; right). Values of V > 2.87 or V < −2.87 indicate a statistical significance above 3σ in the preferential orientation around θ = 0° or θ = 90°, respectively. The yellow circular marker indicates the position of the Sun. The overlaid curves correspond to the spiral arm models identified in Reid et al. (2019), shown in black color, and their extrapolation to larger Galactocentric radii, shown in green.
Current usage metrics show cumulative count of Article Views (full-text article views including HTML views, PDF and ePub downloads, according to the available data) and Abstracts Views on Vision4Press platform.
Data correspond to usage on the plateform after 2015. The current usage metrics is available 48-96 hours after online publication and is updated daily on week days.
Initial download of the metrics may take a while.