Fig. C.1
Download original image
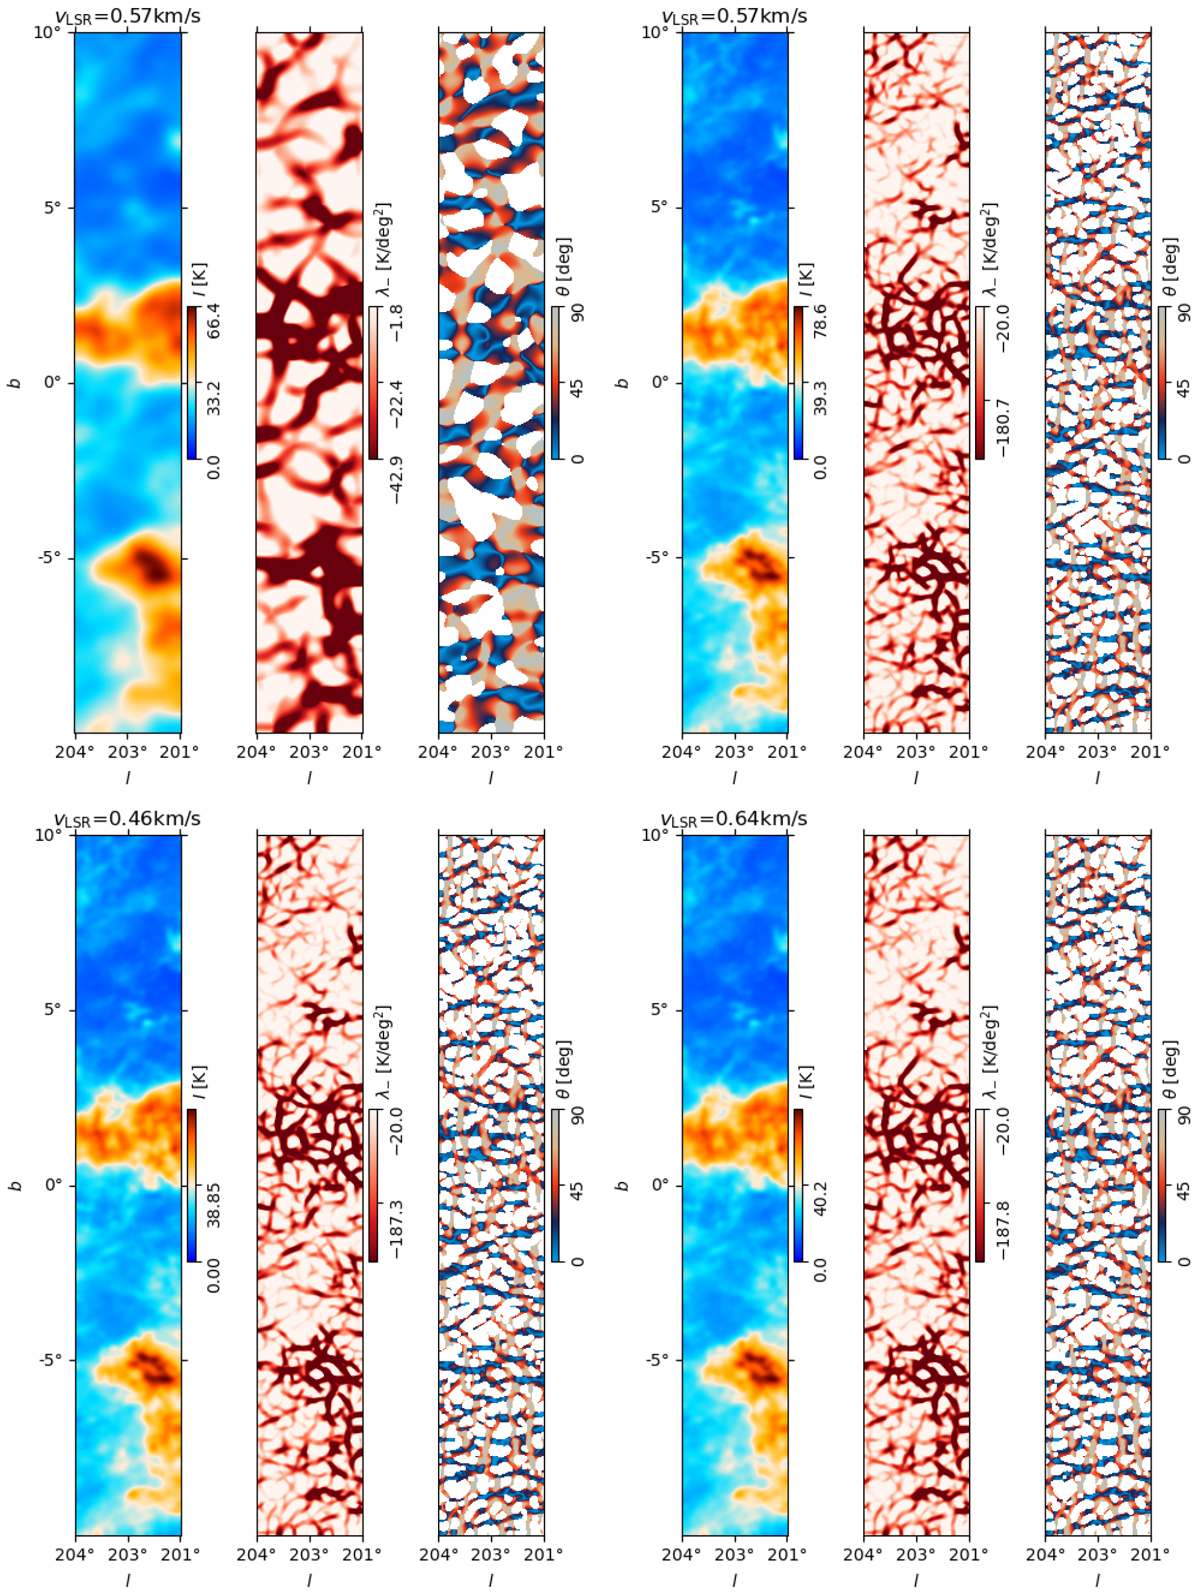
Hessian matrix analysis applied to the HI4PI and the GALFA-H I observations. Top. Results obtained on a 3° × 20° × 1.29 km s−1 tile in the HI4PI and the GALFA-H I observations, shown in the left and right panels, respectively. Bottom. Results obtained on two 3° × 20° × 0.184 km s−1 tiles in the GALFA-H I observations. In each of the panels, the left-hand side map shows the H I emission convolved with a 2D Gaussian with the same diameter of the derivative kernel. The map in the center shows the second eigenvalues of the Hessian matrix, λ−, which highlights the filamentary structure. The right-hand side map shows the orientation angle of the filamentary structure.
Current usage metrics show cumulative count of Article Views (full-text article views including HTML views, PDF and ePub downloads, according to the available data) and Abstracts Views on Vision4Press platform.
Data correspond to usage on the plateform after 2015. The current usage metrics is available 48-96 hours after online publication and is updated daily on week days.
Initial download of the metrics may take a while.