Fig. 2
Download original image
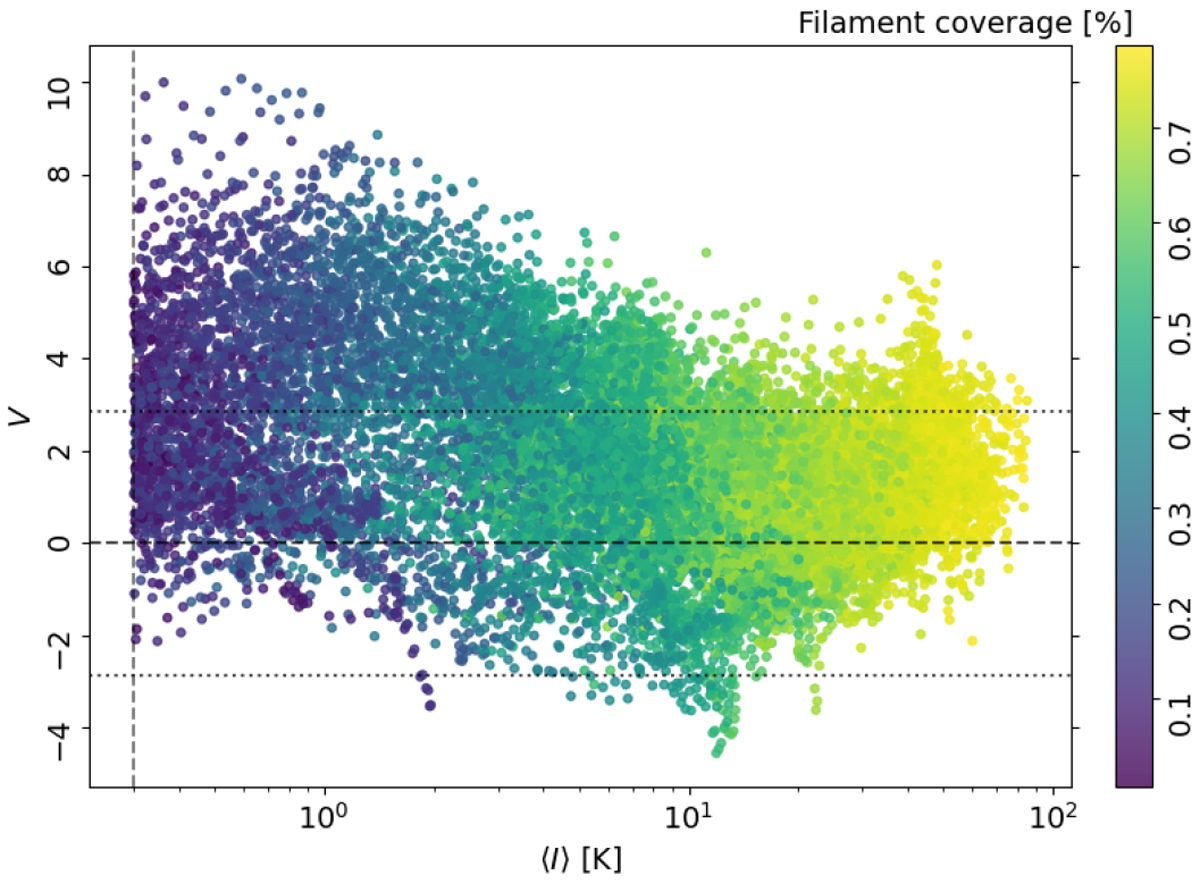
Mean H I emission intensity (〈I〉) and projected Rayleigh statistic (V, Eq. (4)) for the 3° × 20° × 1.29 km s−1 tiles. The colors indicate the tile percentage covered by the filamentary structures selected following the criteria described in Sect. 3.2. The horizontal dotted lines show V = ±2.87, which indicate the 3σ significance in the preferential orientation parallel, θ = 0°, or perpendicular, θ = 90°, to the Galactic plane, respectively. The vertical dashed line indicates the intensity threshold.
Current usage metrics show cumulative count of Article Views (full-text article views including HTML views, PDF and ePub downloads, according to the available data) and Abstracts Views on Vision4Press platform.
Data correspond to usage on the plateform after 2015. The current usage metrics is available 48-96 hours after online publication and is updated daily on week days.
Initial download of the metrics may take a while.