Fig. 14
Download original image
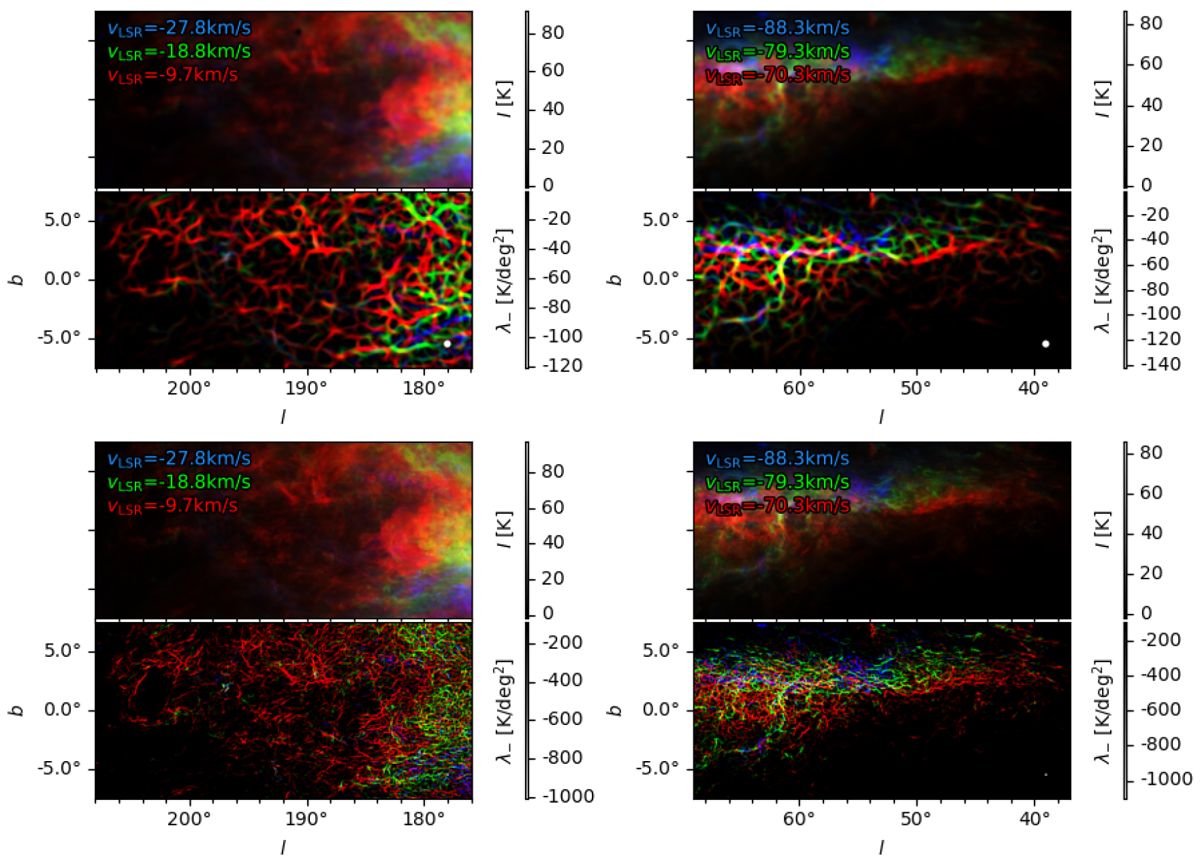
Examples of the H I emission and filamentary structures identified in the HI4PI and the GALFA-H I data, shown in the top and bottom panels respectively. The disk in the lower right corner of each panel indicates the size of the derivative kernels used for the calculation of the Hessian matrix, 18′ and 5′ for the HI4PI and the GALFA-H I observations, respectively.
Current usage metrics show cumulative count of Article Views (full-text article views including HTML views, PDF and ePub downloads, according to the available data) and Abstracts Views on Vision4Press platform.
Data correspond to usage on the plateform after 2015. The current usage metrics is available 48-96 hours after online publication and is updated daily on week days.
Initial download of the metrics may take a while.