Fig. 1
Download original image
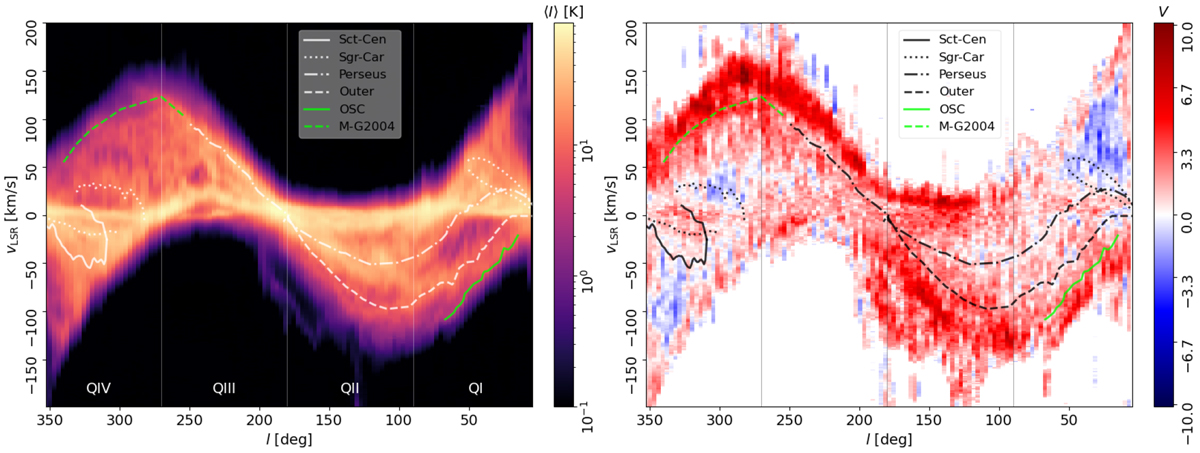
Longitude-velocity (lυ) diagrams of the mean intensity (〈I〉, left) and the filament orientation quantified by the projected Rayleigh statistic (V, right). Each of the pixel elements in the diagrams corresponds to a 3° × 20° × 1.29 km s−1 velocity channel map centered on b = 0°, which we call tile throughout out this paper. These results correspond to the Hessian analysis performed using an 18′ FHWM derivative kernel. Values of V > 0 (red) or V < 0 (blue) indicate a preferential orientation of the filaments parallel, θ = 0°, or perpendicular, θ = 90°, to the Galactic plane. The 3σ statistical significance for these two orientations corresponds to V > 2.87 or V < −2.87, respectively. The overlaid curves correspond to the main spiral arms features presented in Reid et al. (2016), the outer Scutum-Centaurus arm (OSC, Dame & Thaddeus 2011), and the extended outer arm (M-G2004, McClure-Griffiths et al. 2004).
Current usage metrics show cumulative count of Article Views (full-text article views including HTML views, PDF and ePub downloads, according to the available data) and Abstracts Views on Vision4Press platform.
Data correspond to usage on the plateform after 2015. The current usage metrics is available 48-96 hours after online publication and is updated daily on week days.
Initial download of the metrics may take a while.