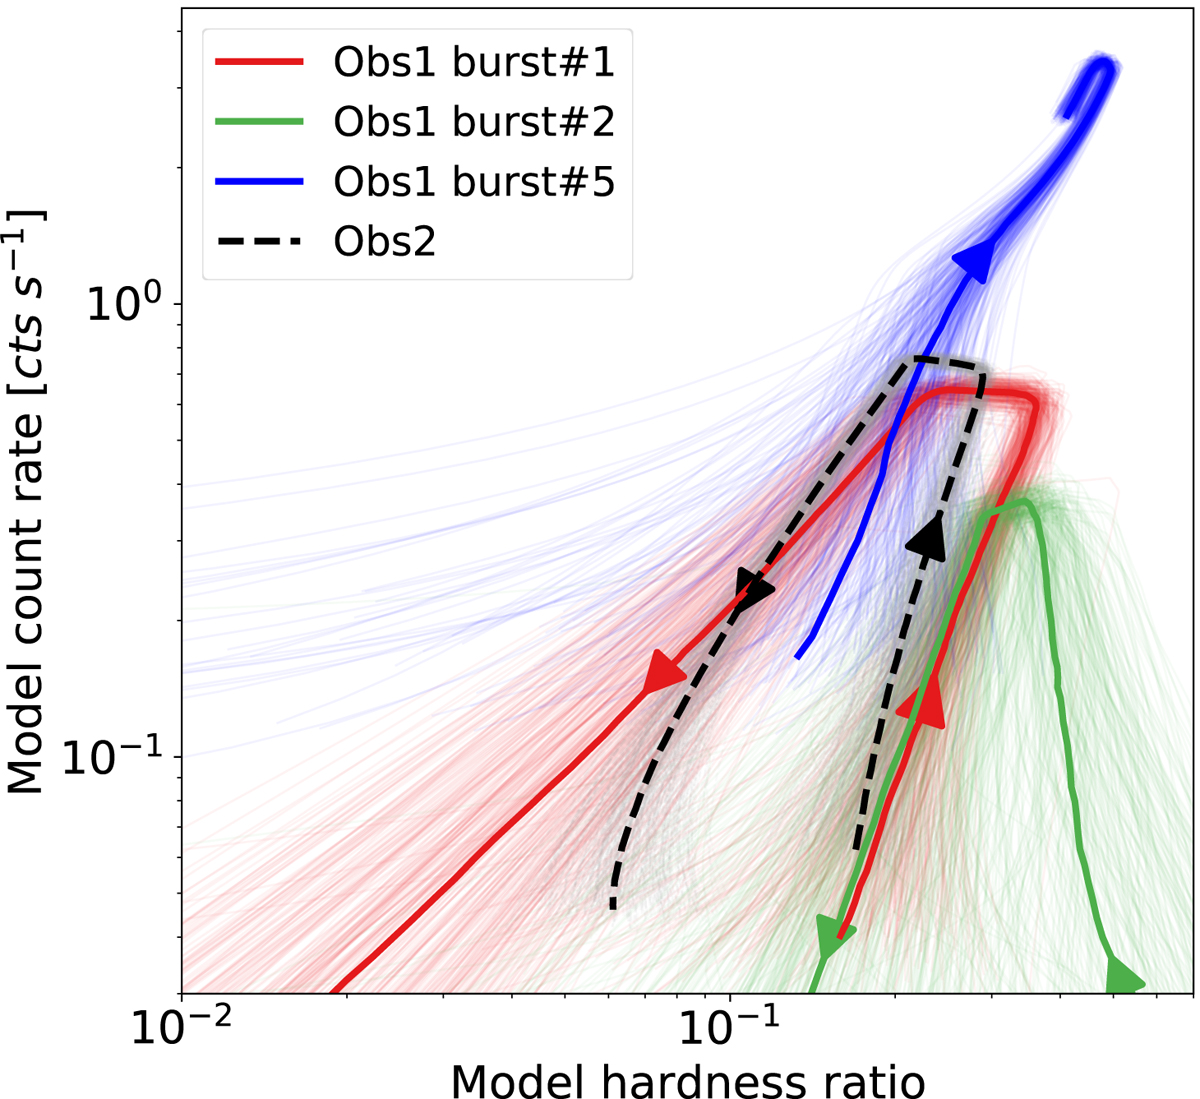
Fig. 8.
Download original image
Hardness ratio vs. count rate computed from the modeled profiles of the bursts in Obs1 (color-coded as in the legend) and Obs2 (dashed black line). For a visual representation of the model profiles see Fig. 2. For Obs1 the profiles are used of bursts that are clearly detected in all the energy bands used for the definition of HR. The thick solid lines represent the median of the modeled tracks, while the thinner lines highlight the span within the model posteriors. A counterclockwise hysteresis (highlighted with arrows on the tracks) is found for all modeled eruptions, which is also what the pure data indicate (Fig. 7).
Current usage metrics show cumulative count of Article Views (full-text article views including HTML views, PDF and ePub downloads, according to the available data) and Abstracts Views on Vision4Press platform.
Data correspond to usage on the plateform after 2015. The current usage metrics is available 48-96 hours after online publication and is updated daily on week days.
Initial download of the metrics may take a while.