Fig. 7.
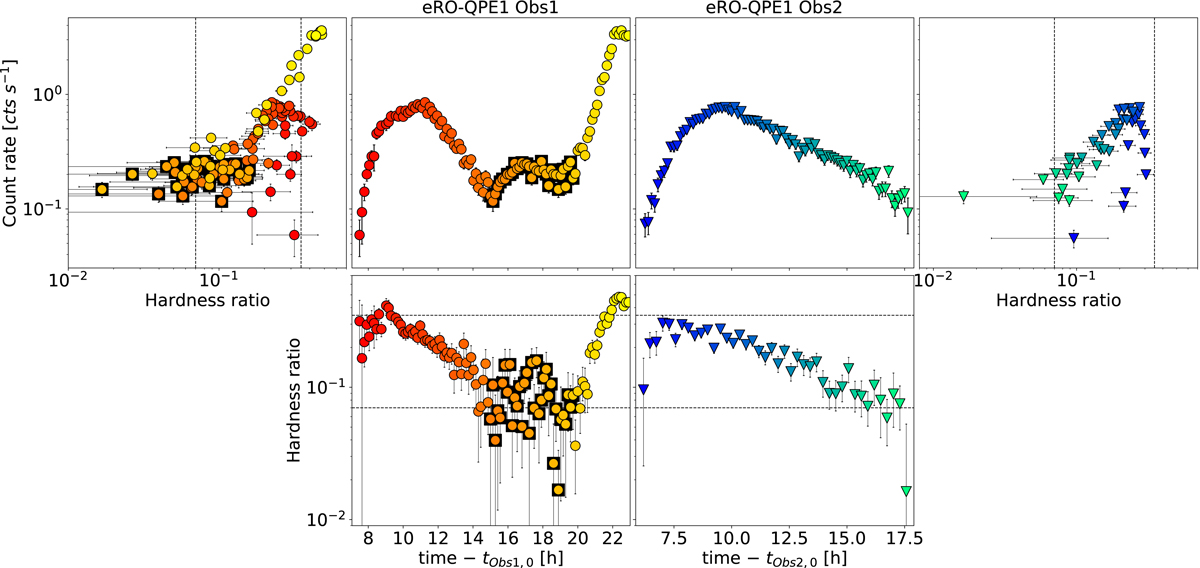
Download original image
Plots showing results for Obs1 (resp. Obs2) of eRO-QPE1, on the left (right), represented with colored circles (triangles), for which darker to lighter colors with a red-to-yellow (blue-to-green) color map indicate the increase in time of the observation. Top central panels: count rate (CR) light curve as in Fig. 2, but here in logarithmic units and excluding the quiescence. Bottom panels: evolution of hardness ratio (HR = H/(H + S) = CR0.6 − 2.0 keV/CR0.2 − 2.0 keV) over time. External panels: HR vs. CR plot. In the panels related to Obs1, the central data points are highlighted with black squares for ease of comparison across the panels. The range of Obs2 in HR is shown as black dashed lines across the different panels. The HR reached at the peak of the eruptions is count rate dependent, and the eruptions undergo a counterclockwise hysteresis cycle in the HR vs. CR plot (top right).
Current usage metrics show cumulative count of Article Views (full-text article views including HTML views, PDF and ePub downloads, according to the available data) and Abstracts Views on Vision4Press platform.
Data correspond to usage on the plateform after 2015. The current usage metrics is available 48-96 hours after online publication and is updated daily on week days.
Initial download of the metrics may take a while.