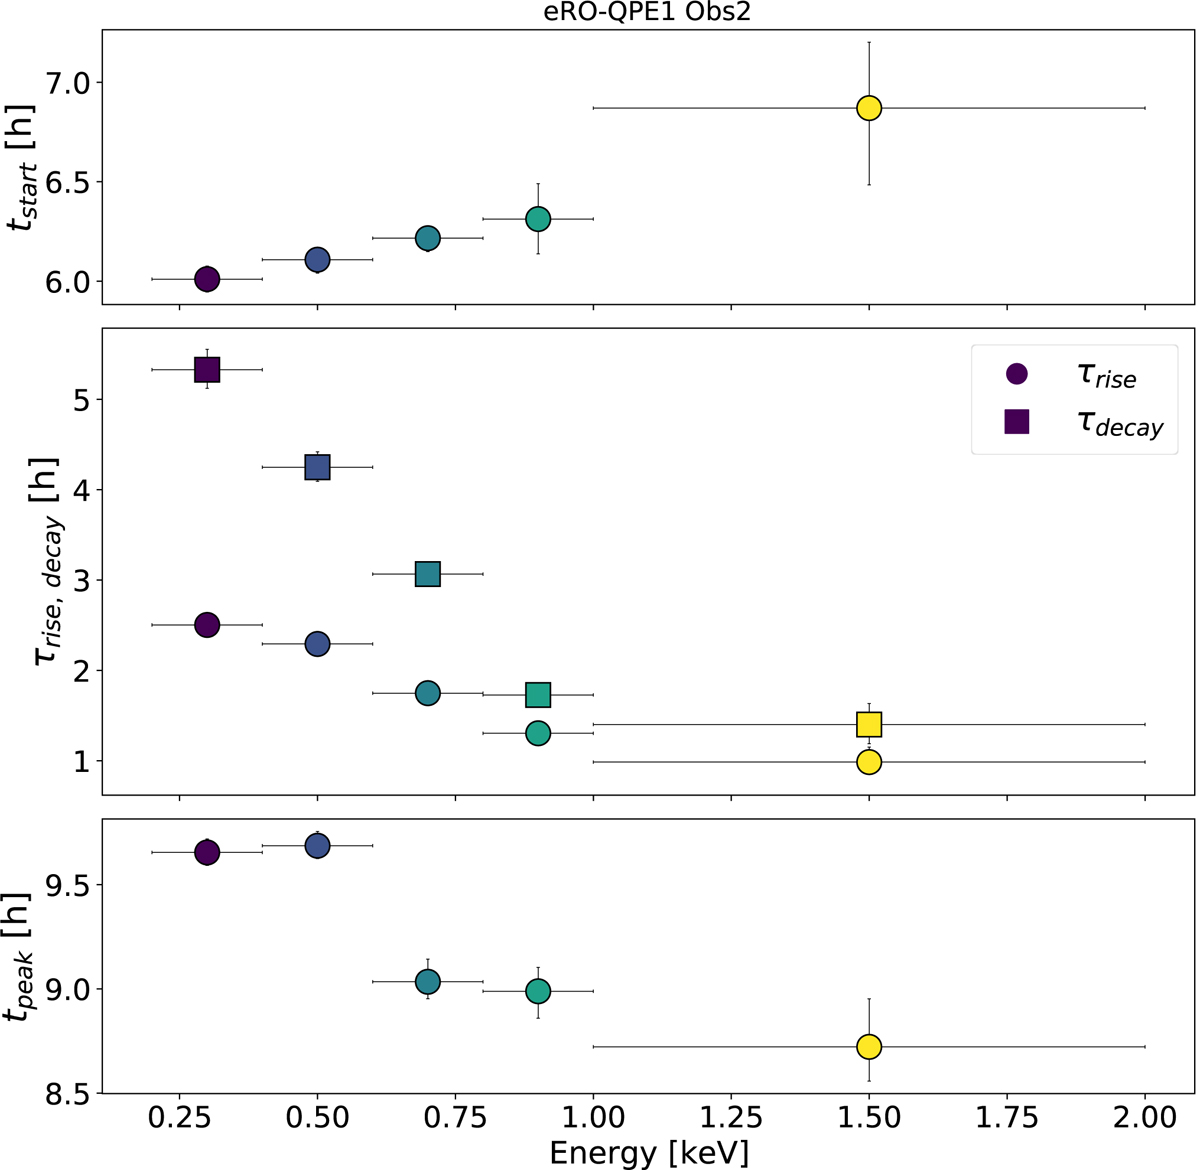
Fig. 4.
Download original image
Energy dependence of QPEs in the observation Obs2 of eRO-QPE1 (related to the light curve shown in Fig. 3). The times tstart and tpeak are shown in hours elapsed from tObs2, 0. QPEs start earlier at lower energies (top panel) and evolve more slowly in terms of rise and decay (middle panel), and peak at later times (bottom panel) at low energies.
Current usage metrics show cumulative count of Article Views (full-text article views including HTML views, PDF and ePub downloads, according to the available data) and Abstracts Views on Vision4Press platform.
Data correspond to usage on the plateform after 2015. The current usage metrics is available 48-96 hours after online publication and is updated daily on week days.
Initial download of the metrics may take a while.