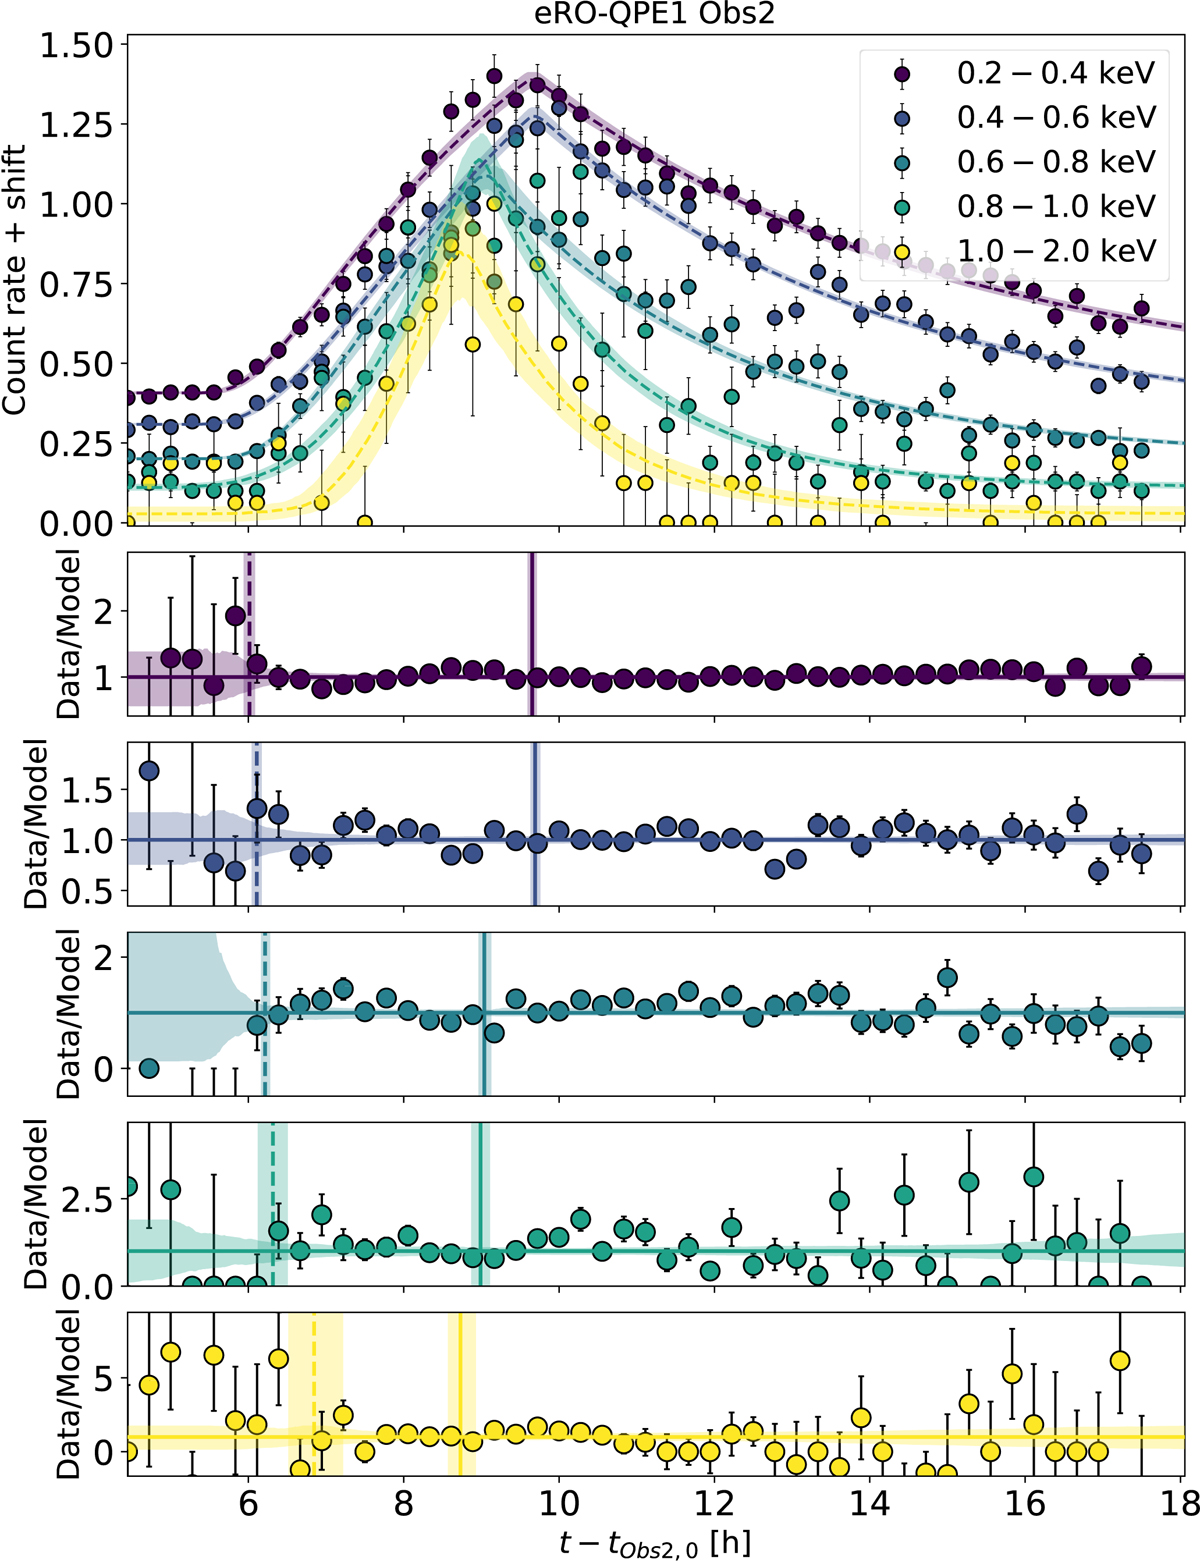
Fig. 3.
Download original image
XMM-Newton light curve of Obs2 extracted in small energy bins, represented with different colors (see legend). Each light curve is vertically shifted by a constant factor for visualization. The subpanels show the data-model residuals in each energy bin, color-coded accordingly; vertical dashed lines (with related 1σ uncertainties) indicate when the eruptions start in the given energy bin, while vertical solid lines identify the peak. The model adopted is described by Eq. (1), and it is shown in all panels with 1σ uncertainty as shaded intervals.
Current usage metrics show cumulative count of Article Views (full-text article views including HTML views, PDF and ePub downloads, according to the available data) and Abstracts Views on Vision4Press platform.
Data correspond to usage on the plateform after 2015. The current usage metrics is available 48-96 hours after online publication and is updated daily on week days.
Initial download of the metrics may take a while.