Open Access
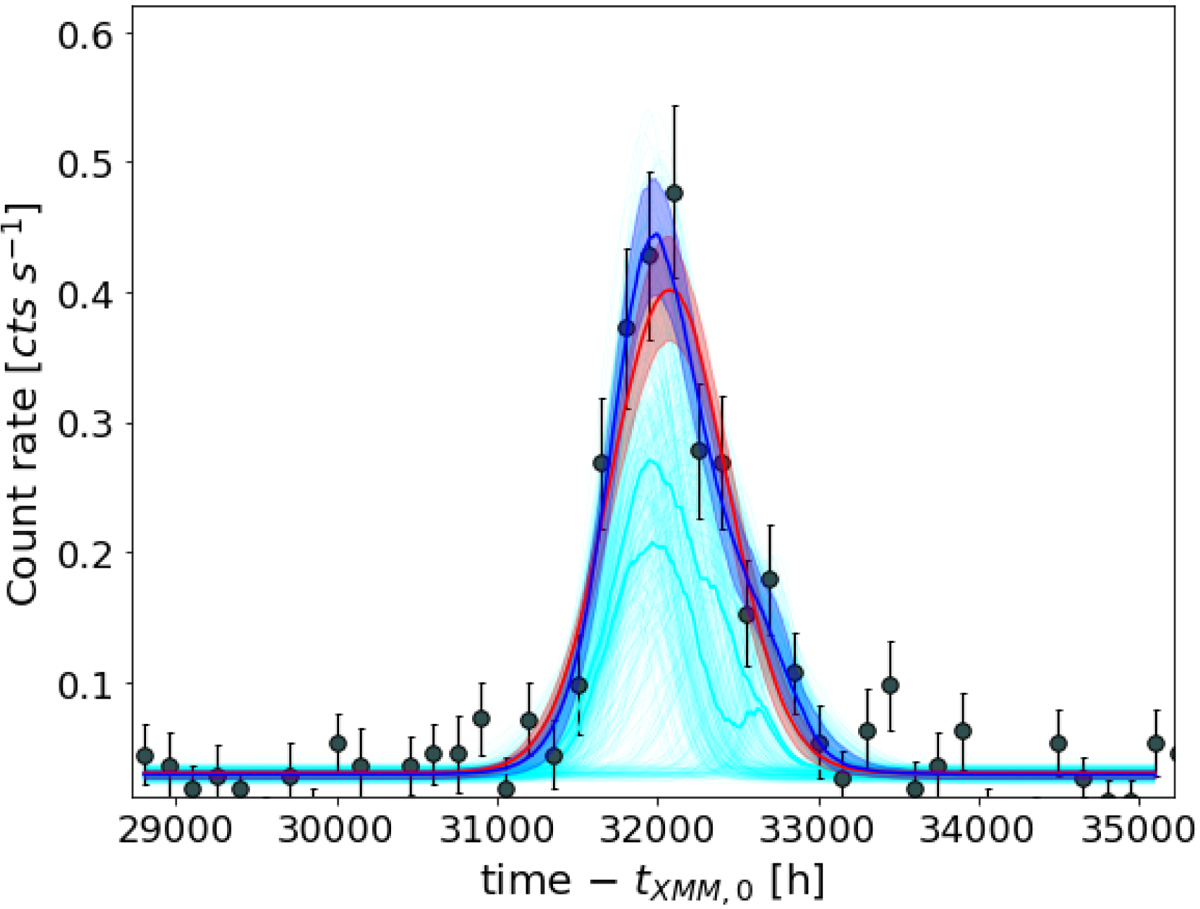
Fig. A.3.
Download original image
Eruption number four in the XMM-Newton light curve of eRO-QPE2 (see also Fig. 1). The red curve represents the fit with one Gaussian component, the blue curve the superposition of two Gaussian profiles is shown, and the cyan lines show the two individual Gaussian components (the median is shown with a thicker line).
Current usage metrics show cumulative count of Article Views (full-text article views including HTML views, PDF and ePub downloads, according to the available data) and Abstracts Views on Vision4Press platform.
Data correspond to usage on the plateform after 2015. The current usage metrics is available 48-96 hours after online publication and is updated daily on week days.
Initial download of the metrics may take a while.