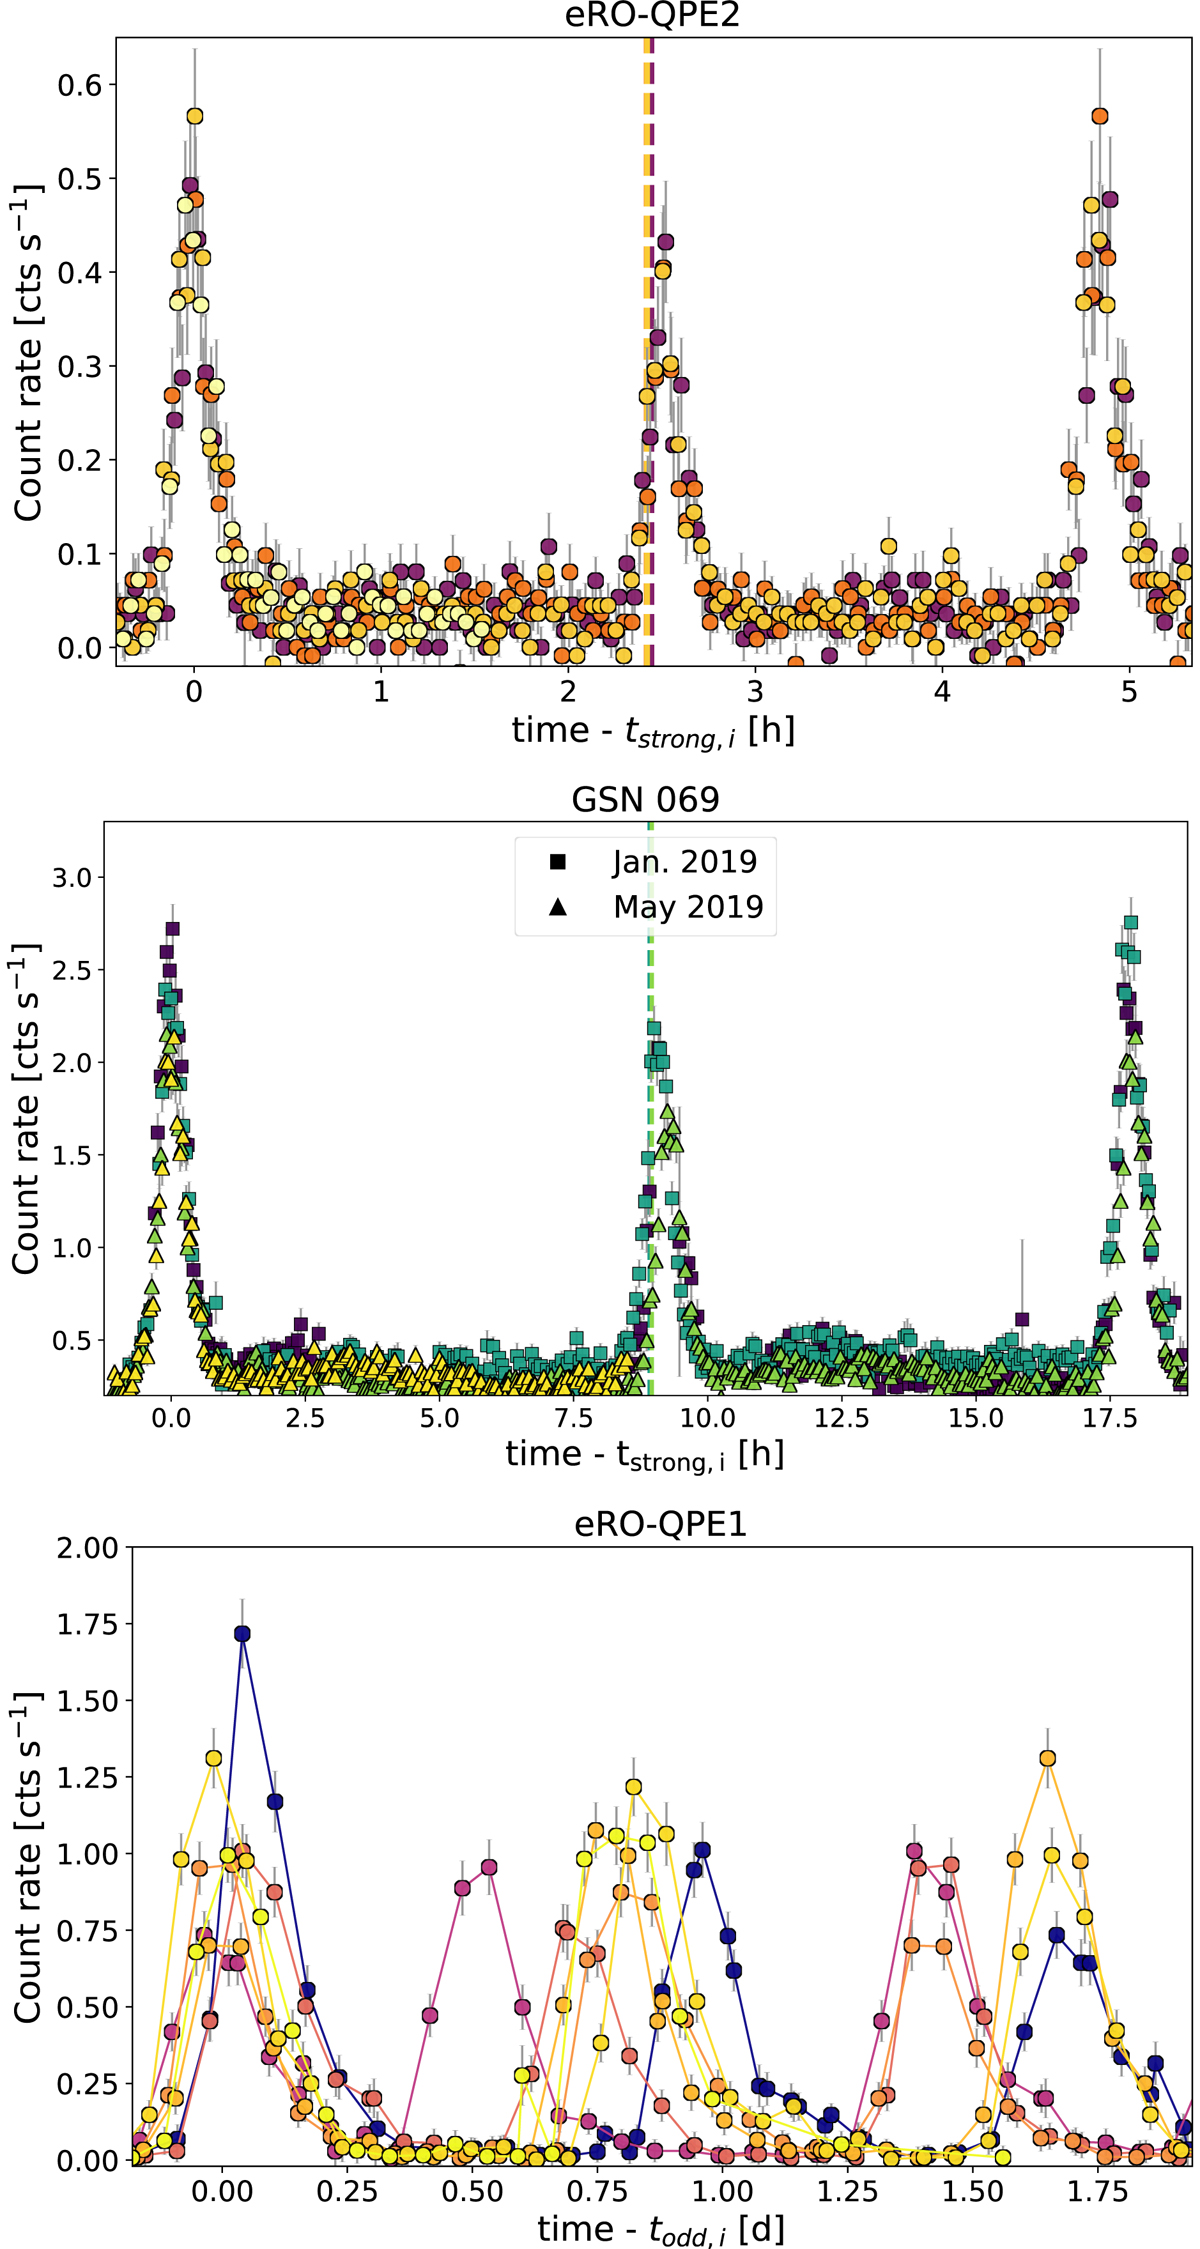
Fig. 1.
Download original image
X-ray eruptions of the sources eRO-QPE2 (top, see A21) and GSN 069 (middle, see M19), compared to those of eRO-QPE1 (bottom, see A21). The first two sources show alternating longer and shorter recurrence times and stronger and weaker bursts. In these plots (top and middle), eruptions of each source are overlapped in time-space by scaling each strong-weak-strong cycle (shown with a different color) with the related peak time of the first strong burst. The dashed vertical lines show the time corresponding to half of the separation between two strong bursts (i.e., between consecutive bursts aligned to zero), highlighting that the intermediate weak bursts occur systematically later in time (and that two recurrence times alternate). Bottom panel: the full light curve of eRO-QPE1 reported in A21 is here separated into chunks of two consecutive cycles and scaled in time at the peak of the odd eruptions to highlight a more complex distribution of recurrence and burst duration times.
Current usage metrics show cumulative count of Article Views (full-text article views including HTML views, PDF and ePub downloads, according to the available data) and Abstracts Views on Vision4Press platform.
Data correspond to usage on the plateform after 2015. The current usage metrics is available 48-96 hours after online publication and is updated daily on week days.
Initial download of the metrics may take a while.