Fig. 2
Download original image
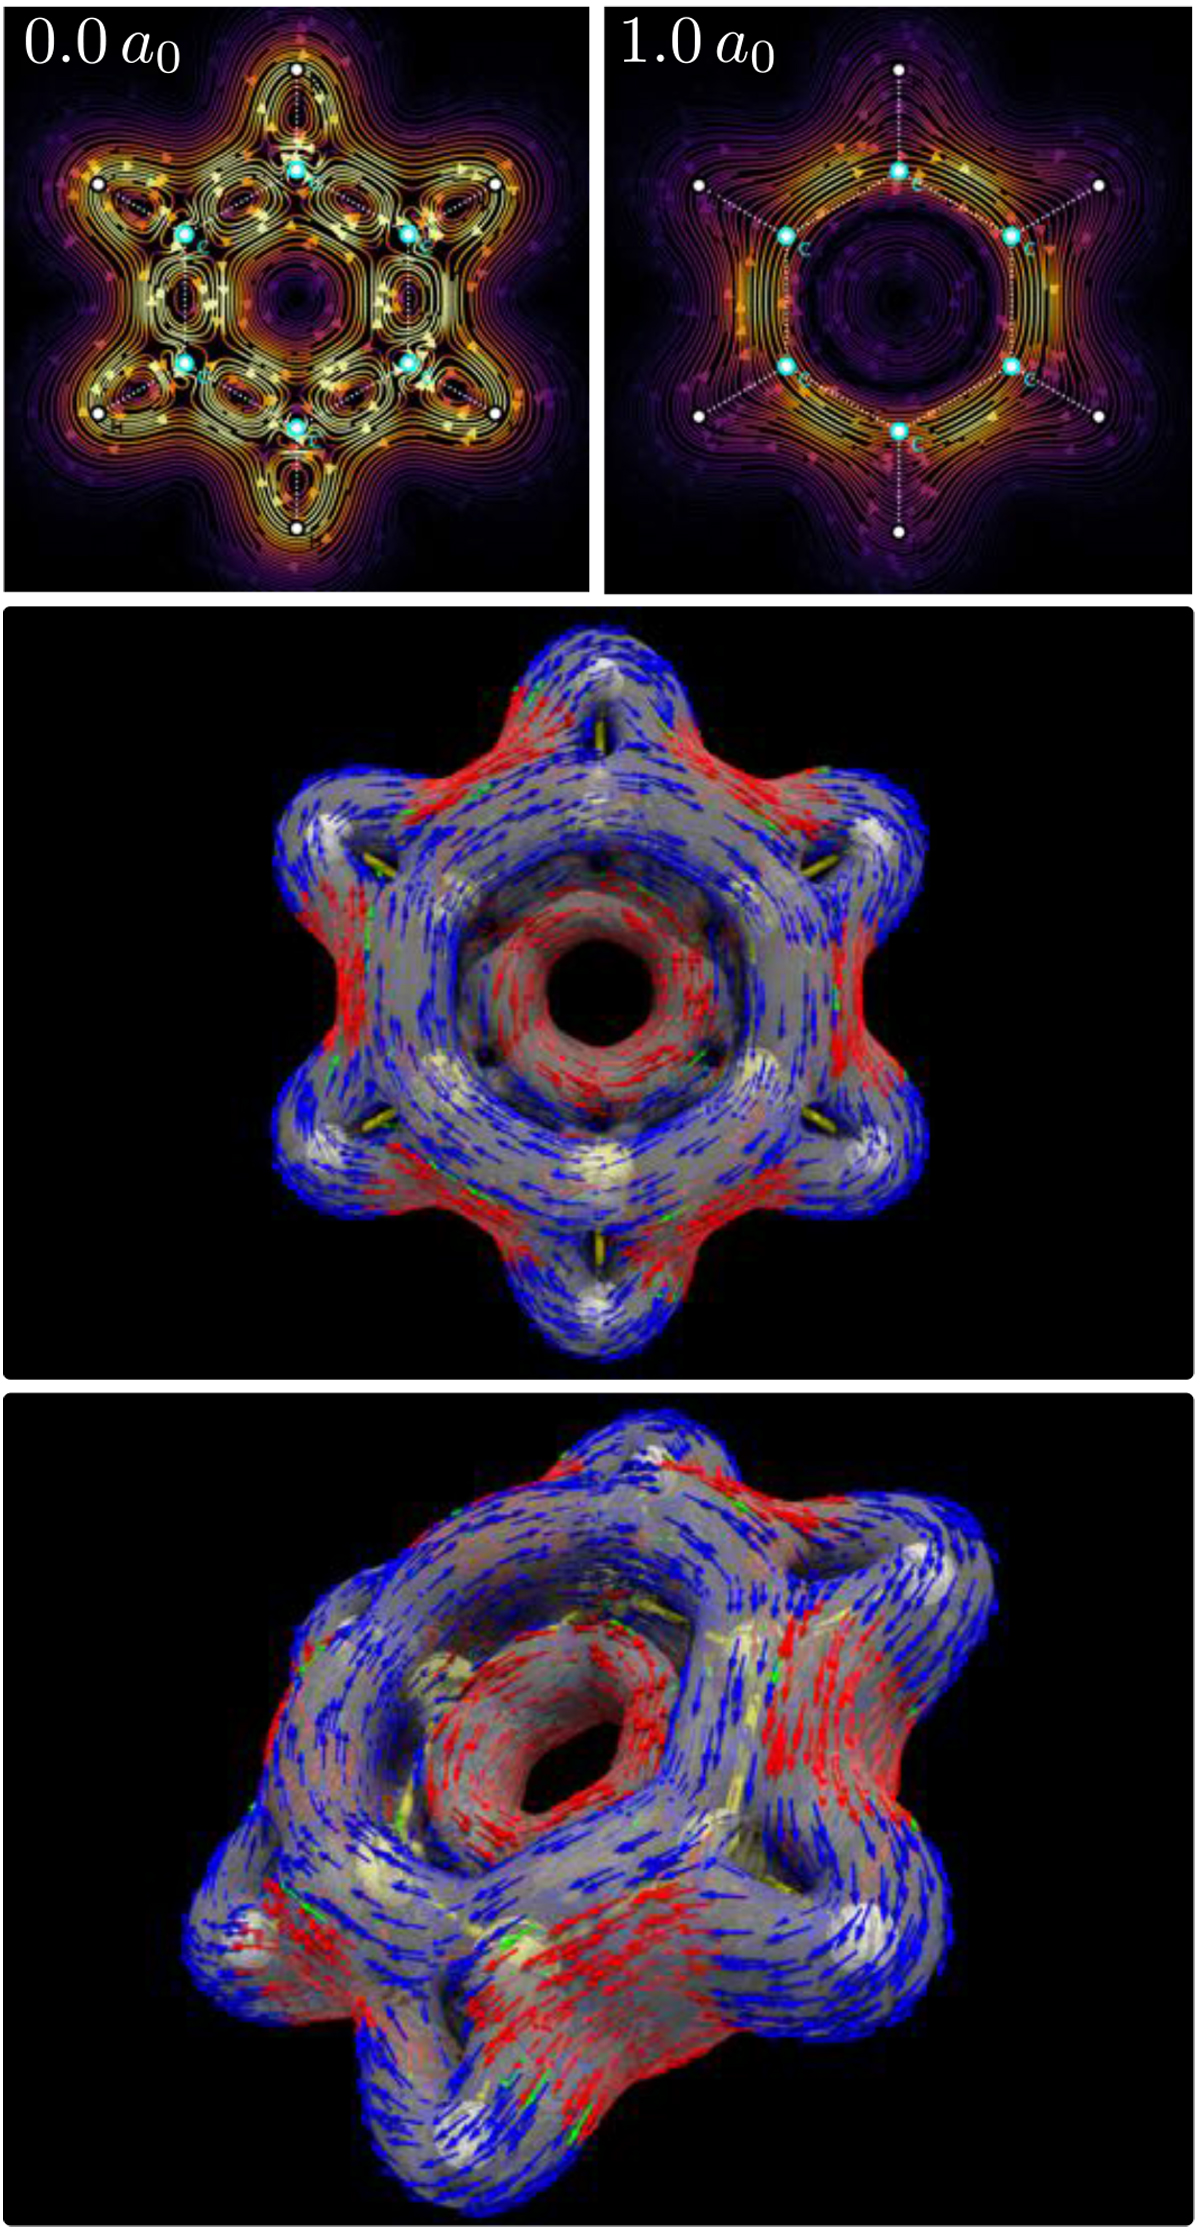
Visualization of the current density maps (or flow) to analyze aromaticity. This visualization is realized using both two-dimensional and three-dimensional stream- line plots. The clockwise (diatropic) and counterclockwise (paratropic) direction of the current flow indicates aromaticity or antiaromaticy, respectively. Top: Current density maps (C at the molecular plane and at 1a0 (1 bohr) distance from the plane of the benzene ring). The current flow is represented by streamlines; the magnitudes of the currents are indicated by a decreasing scale: white-yellow-red-black. Middle and bottom: Two orientations of the three-dimensional current density vector field.
Current usage metrics show cumulative count of Article Views (full-text article views including HTML views, PDF and ePub downloads, according to the available data) and Abstracts Views on Vision4Press platform.
Data correspond to usage on the plateform after 2015. The current usage metrics is available 48-96 hours after online publication and is updated daily on week days.
Initial download of the metrics may take a while.