Free Access
Fig. 1
Download original image
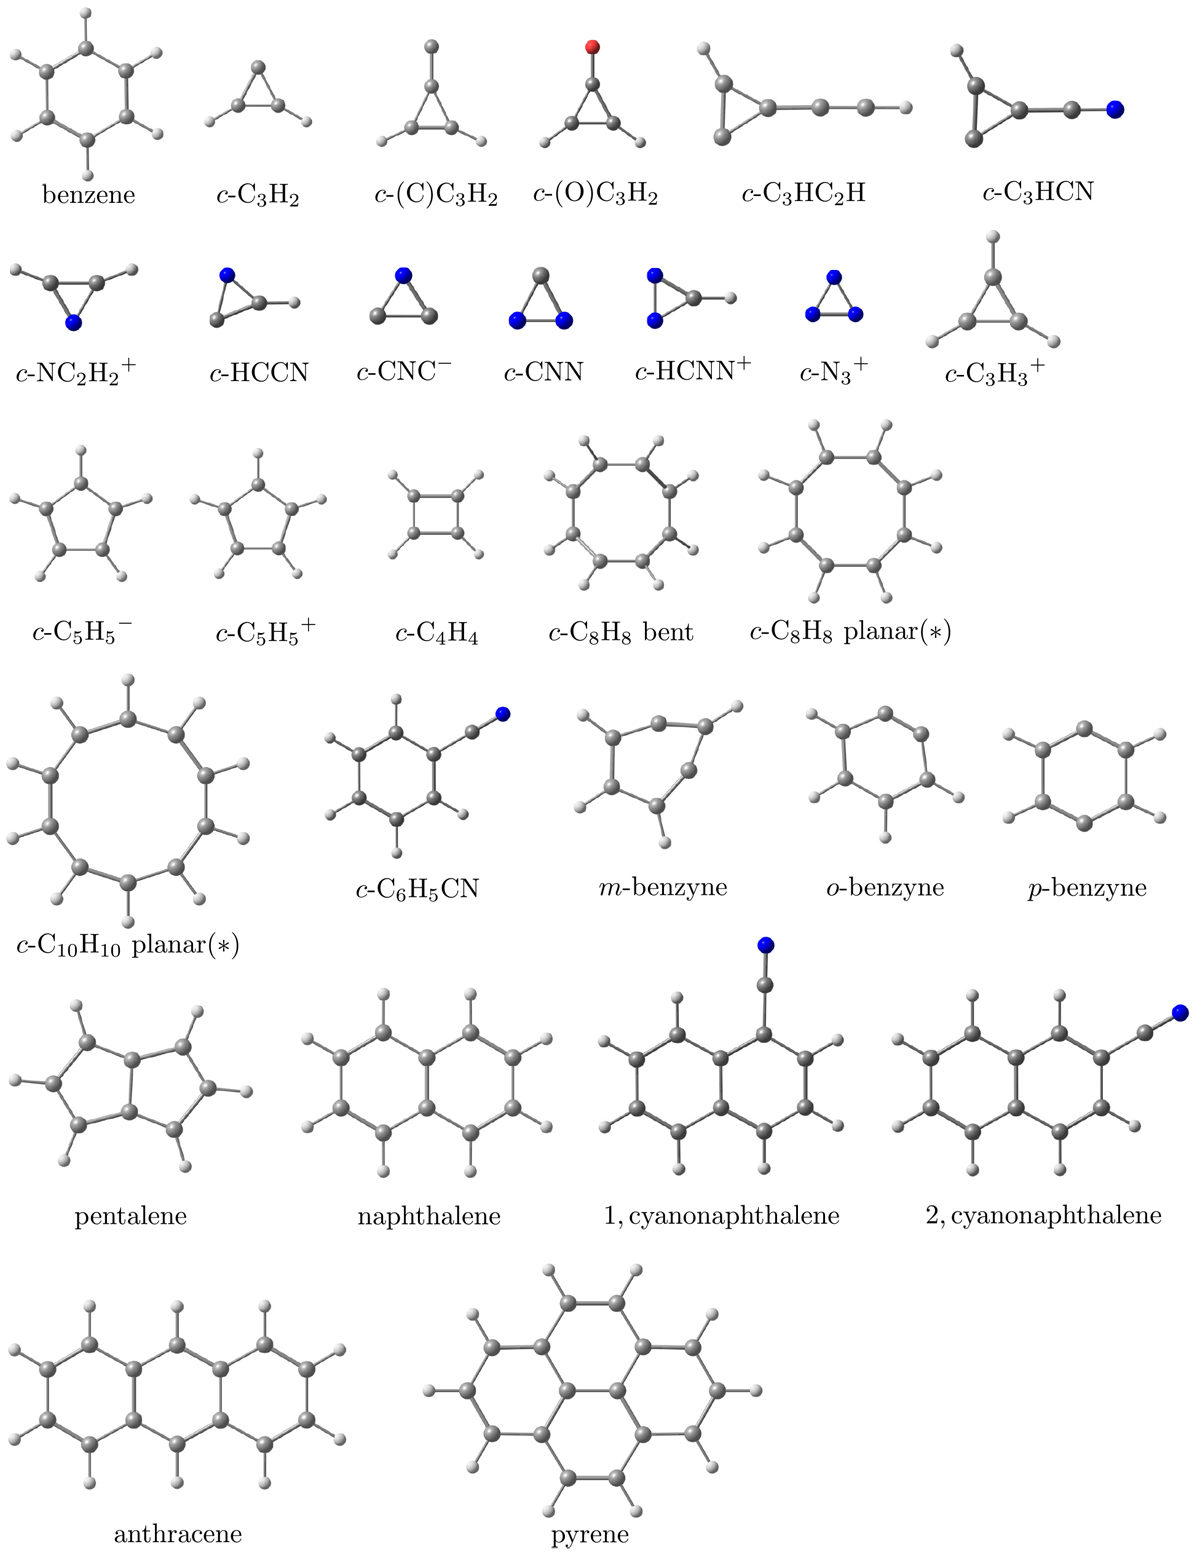
Optimized cyclic molecules (at the B3LYP/aug-cc-pVTZ level) considered in this work. Spheres in gray, light gray, blue, and red represent C, H, N, and O, respectively. The molecules flagged with (*) are forced to be planar, but are actually transition states on their potential energy surface.
Current usage metrics show cumulative count of Article Views (full-text article views including HTML views, PDF and ePub downloads, according to the available data) and Abstracts Views on Vision4Press platform.
Data correspond to usage on the plateform after 2015. The current usage metrics is available 48-96 hours after online publication and is updated daily on week days.
Initial download of the metrics may take a while.