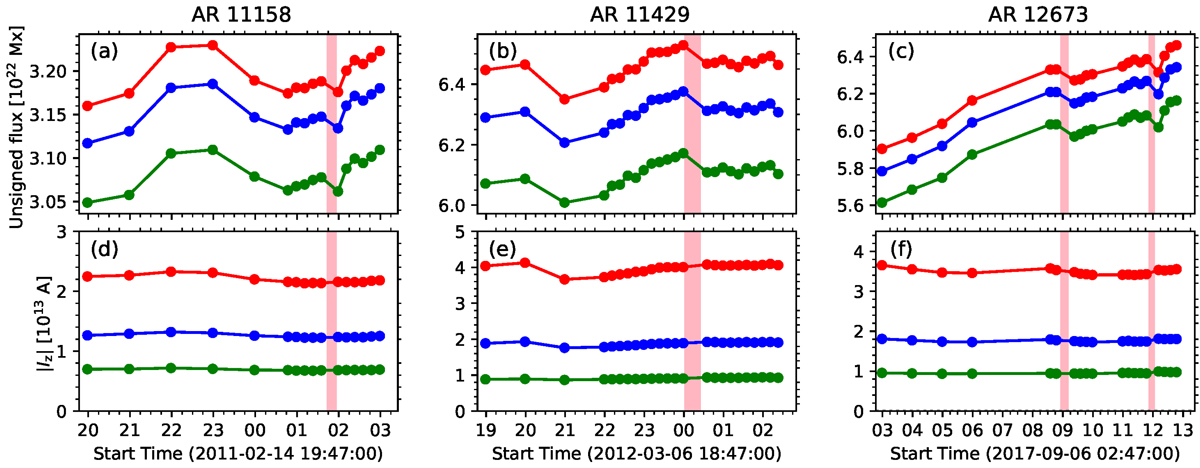
Fig. 1.
Download original image
Area-integrated parameters computed from the photospheric vector data at three different pixel sizes as a function of time for three ARs. Top: unsigned magnetic flux, |Φm|. Bottom: unsigned vertical current, |Iz|. Red, blue, and green colors correspond to bin1, bin2, and bin4 data, respectively, with inherent plate scales of ∼0.36, ∼0.72, and ∼1.4 Mm. Vertical bars indicate the impulsive phase of X-class flares that occurred during the time intervals analyzed.
Current usage metrics show cumulative count of Article Views (full-text article views including HTML views, PDF and ePub downloads, according to the available data) and Abstracts Views on Vision4Press platform.
Data correspond to usage on the plateform after 2015. The current usage metrics is available 48-96 hours after online publication and is updated daily on week days.
Initial download of the metrics may take a while.