Fig. 8
Download original image
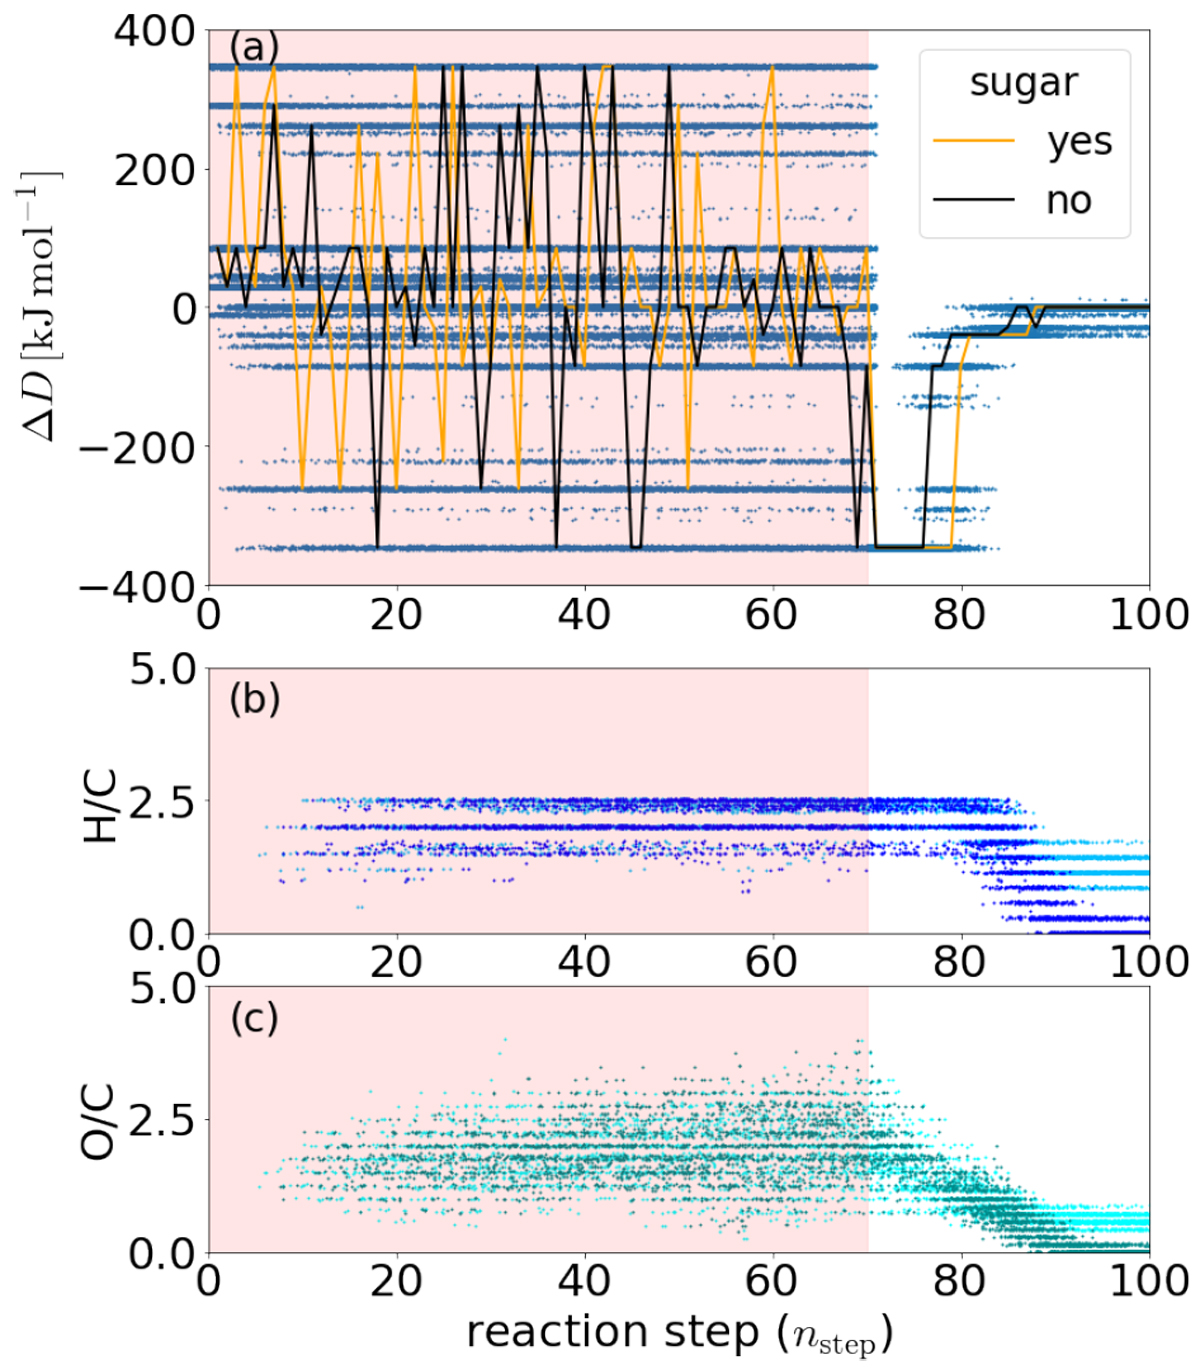
Dissociation energy and associated composition changes of large molecules along reaction sequences in the UV phase (nstep = 1–70) and the post-UV phase (nstep = 71–100). The top panel is (a) the distribution of ΔD selected by the Monte Carlo simulations at each step in 103 runs in set P1. The horizontal axis is a reaction step, and the vertical axis is ΔD in units of kJ mol−1. The yellow and black lines are typical reaction sequences where 5-C sugar is formed and that without sugar formation, respectively. The middle and bottom panels show the distributions of (b) H/C and (c) O/C ratios of the molecules with four or more carbon atoms at each step in the 103 runs. The dark colored dots indicate the results in the case allowing the formation of three- or four-membered ring structures, and light colored dots are the results where their formation is prohibited. For visual convenience, the dots with the same ΔD, H/C, and O/C at nstep are shifted slightly so that they do not overlap and clustered dots represent frequent events.
Current usage metrics show cumulative count of Article Views (full-text article views including HTML views, PDF and ePub downloads, according to the available data) and Abstracts Views on Vision4Press platform.
Data correspond to usage on the plateform after 2015. The current usage metrics is available 48-96 hours after online publication and is updated daily on week days.
Initial download of the metrics may take a while.