Fig. 7
Download original image
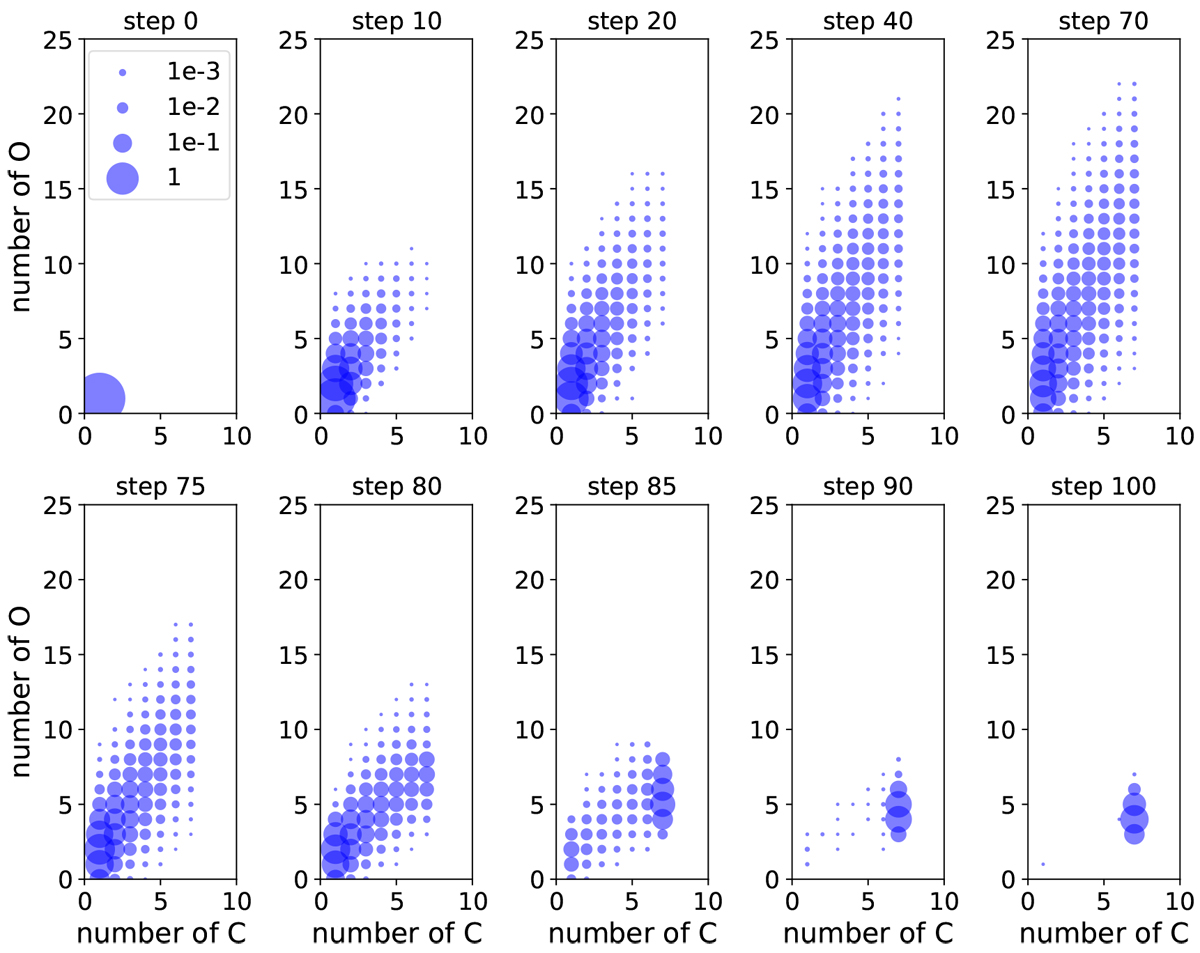
Evolution of the molecule distribution for the fiducial parameters. The horizontal and vertical axes indicate the number of C and O in the individual molecules at each step. All of the molecules with different numbers of C and O at each step are plotted with the abundance (out of the total runs nrun = 105) represented by the circle sizes. The upper and lower panels show the evolution in the UV phase and the post-UV phase, respectively.
Current usage metrics show cumulative count of Article Views (full-text article views including HTML views, PDF and ePub downloads, according to the available data) and Abstracts Views on Vision4Press platform.
Data correspond to usage on the plateform after 2015. The current usage metrics is available 48-96 hours after online publication and is updated daily on week days.
Initial download of the metrics may take a while.