Free Access
Fig. 12
Download original image
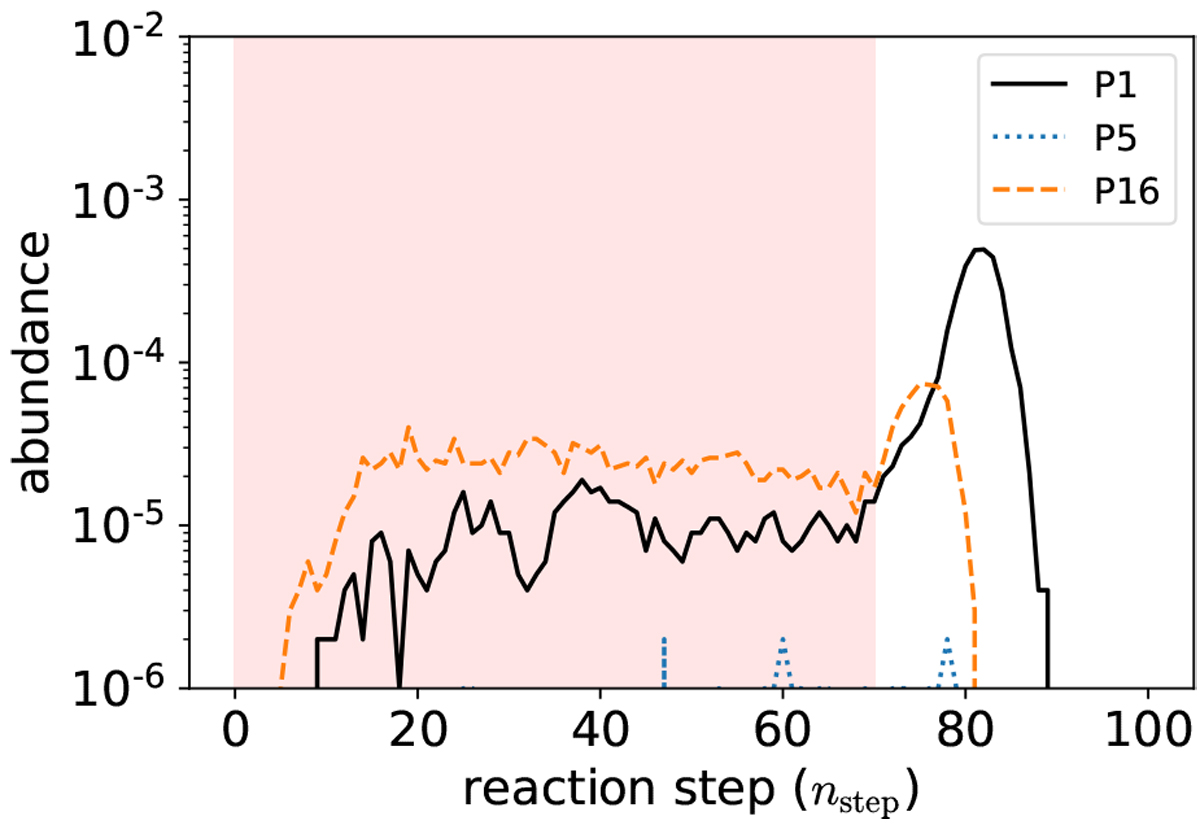
Abundance of 5-C sugar as a function of a reaction step in the simulations for P1, P5, and P16 when TU = 105 K, Tp = 300 K, and nrun = 106. The black solid, blue dotted, and orange dashed lines represent the results for P1, P5, and P16, respectively.
Current usage metrics show cumulative count of Article Views (full-text article views including HTML views, PDF and ePub downloads, according to the available data) and Abstracts Views on Vision4Press platform.
Data correspond to usage on the plateform after 2015. The current usage metrics is available 48-96 hours after online publication and is updated daily on week days.
Initial download of the metrics may take a while.