Free Access
Fig. 11
Download original image
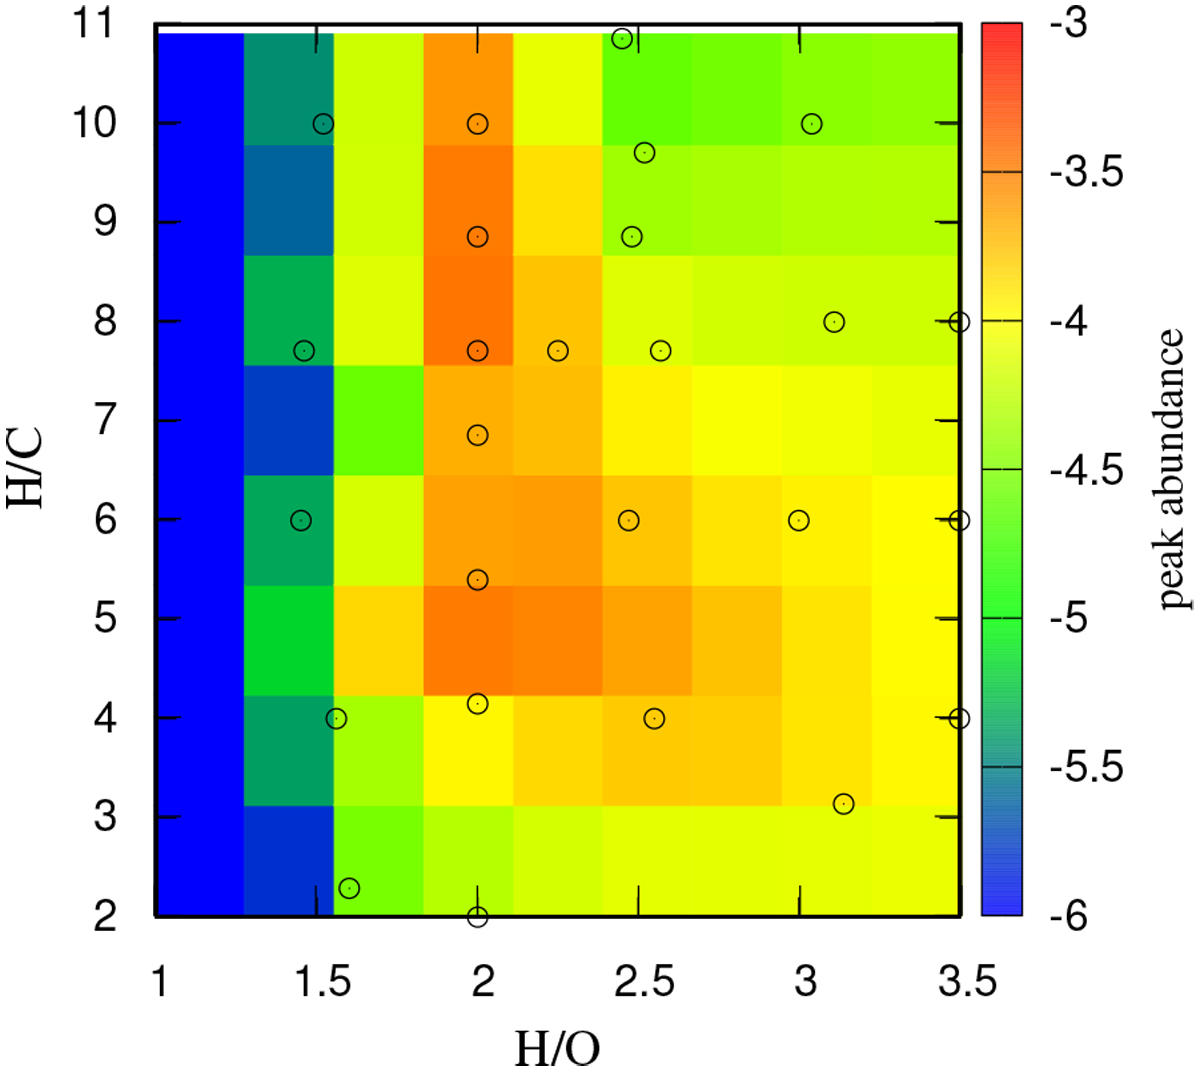
Peak value of sugar abundance in the post-UV phase for different element ratios of starting materials. The horizontal axis is the H/O ratio, and the vertical axis is the H/C ratio. The colored bar indicates the peak value with a logarithmic scale; smaller to larger values from blue to red.
Current usage metrics show cumulative count of Article Views (full-text article views including HTML views, PDF and ePub downloads, according to the available data) and Abstracts Views on Vision4Press platform.
Data correspond to usage on the plateform after 2015. The current usage metrics is available 48-96 hours after online publication and is updated daily on week days.
Initial download of the metrics may take a while.