Fig. 10
Download original image
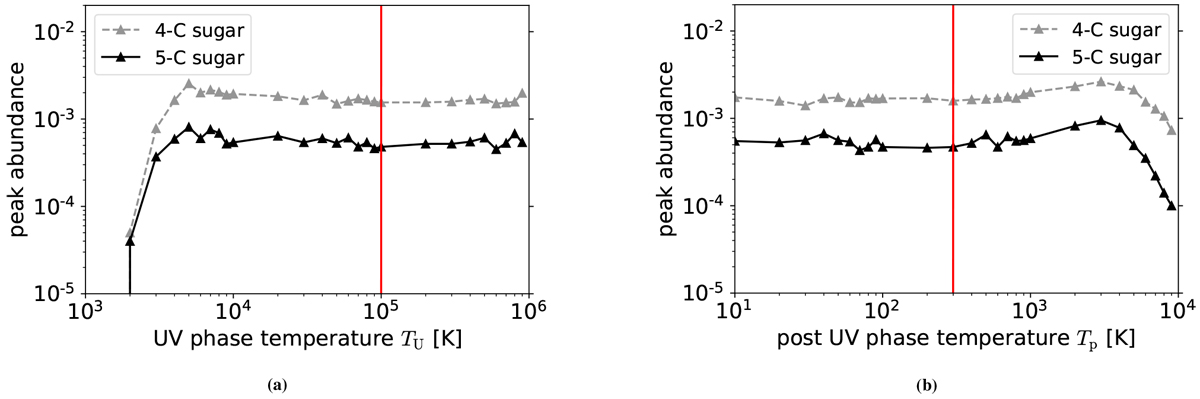
Peak sugar abundances in the post-UV phase for different temperatures when rrun = 105. We use fiducial starting materials. Panel a shows the dependence on temperature of the UV phase when Tp = 300 K, and panel b shows the dependence on temperature of the post-UV phase when TU = 105 K. The gray dashed line and black solid line are for 4-C and 5-C sugars, respectively. Red lines indicate the positions of the fiducial temperatures.
Current usage metrics show cumulative count of Article Views (full-text article views including HTML views, PDF and ePub downloads, according to the available data) and Abstracts Views on Vision4Press platform.
Data correspond to usage on the plateform after 2015. The current usage metrics is available 48-96 hours after online publication and is updated daily on week days.
Initial download of the metrics may take a while.