Fig. B.4
Download original image
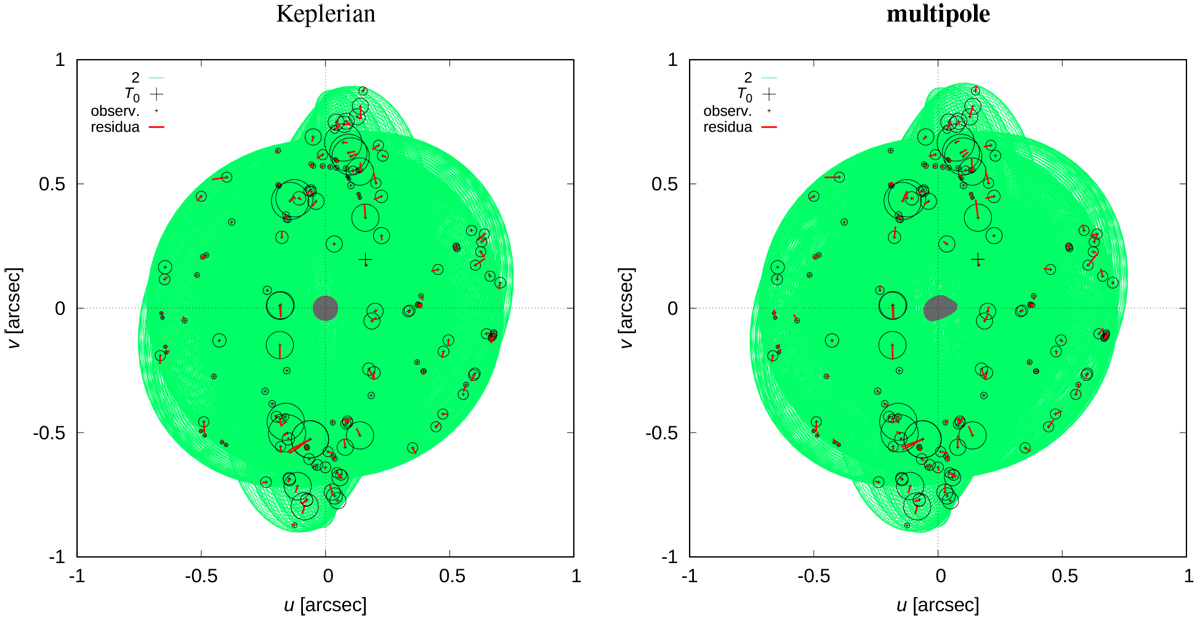
Sky-plane positions (u, υ) and trajectories for two dynamical models: Keplerian (left) and multipole (right). Observed positions are plotted as black crosses and uncertainty ellipses, trajectories (with variable geometry) as green lines, and residuals as red lines. Both models are comparable in terms of ![]() (202 vs 226; see Table 2).
(202 vs 226; see Table 2).
Current usage metrics show cumulative count of Article Views (full-text article views including HTML views, PDF and ePub downloads, according to the available data) and Abstracts Views on Vision4Press platform.
Data correspond to usage on the plateform after 2015. The current usage metrics is available 48-96 hours after online publication and is updated daily on week days.
Initial download of the metrics may take a while.