Fig. 22.
Download original image
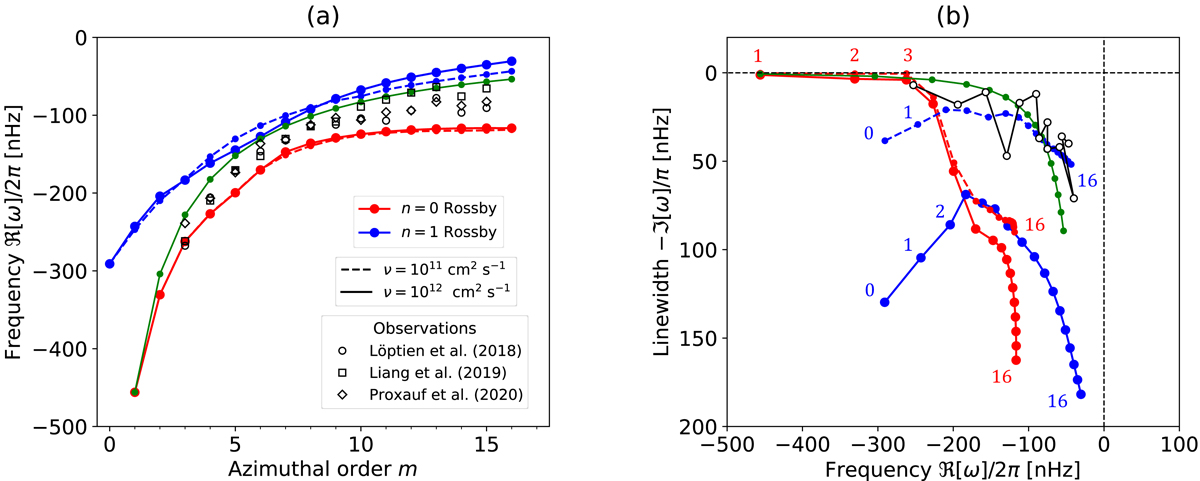
(a) Dispersion relations of the equatorial Rossby modes for the cases with solar differential rotation. Red and blue curves represent the modes with no radial nodes (n = 0) and one radial node (n = 1), respectively. Solid and dashed lines denote the cases with weak diffusion (ν = 1011 cm2 s−1) and strong diffusion (ν = 1012 cm2 s−1), respectively. For comparison, the observed Rossby mode frequencies reported in Löptien et al. (2018), Liang et al. (2019), and Proxauf et al. (2020) are plotted by white hexagons and squares. All the presented frequencies are measured in the Carrington frame rotating at Ω0/2π = 456.0 nHz. (b) Mode linewidths versus mode frequencies. Each point represents a mode with azimuthal order m, which is labeled with small integers from m = 1 to 16. Overplotted (open circles connected by black lines) are the mode linewidths and frequencies measured by Proxauf et al. (2020) for m = 3 to 15. In both panels, the green dots connected by line segments refer to a theoretical model for the simplified case of uniform rotation, ω/Ω0 = −2/(m + 1)−iEkm(m + 1), where Ek = 4 × 10⁻⁴ is the Ekman number at the solar surface (Fournier et al. 2022).
Current usage metrics show cumulative count of Article Views (full-text article views including HTML views, PDF and ePub downloads, according to the available data) and Abstracts Views on Vision4Press platform.
Data correspond to usage on the plateform after 2015. The current usage metrics is available 48-96 hours after online publication and is updated daily on week days.
Initial download of the metrics may take a while.