Open Access
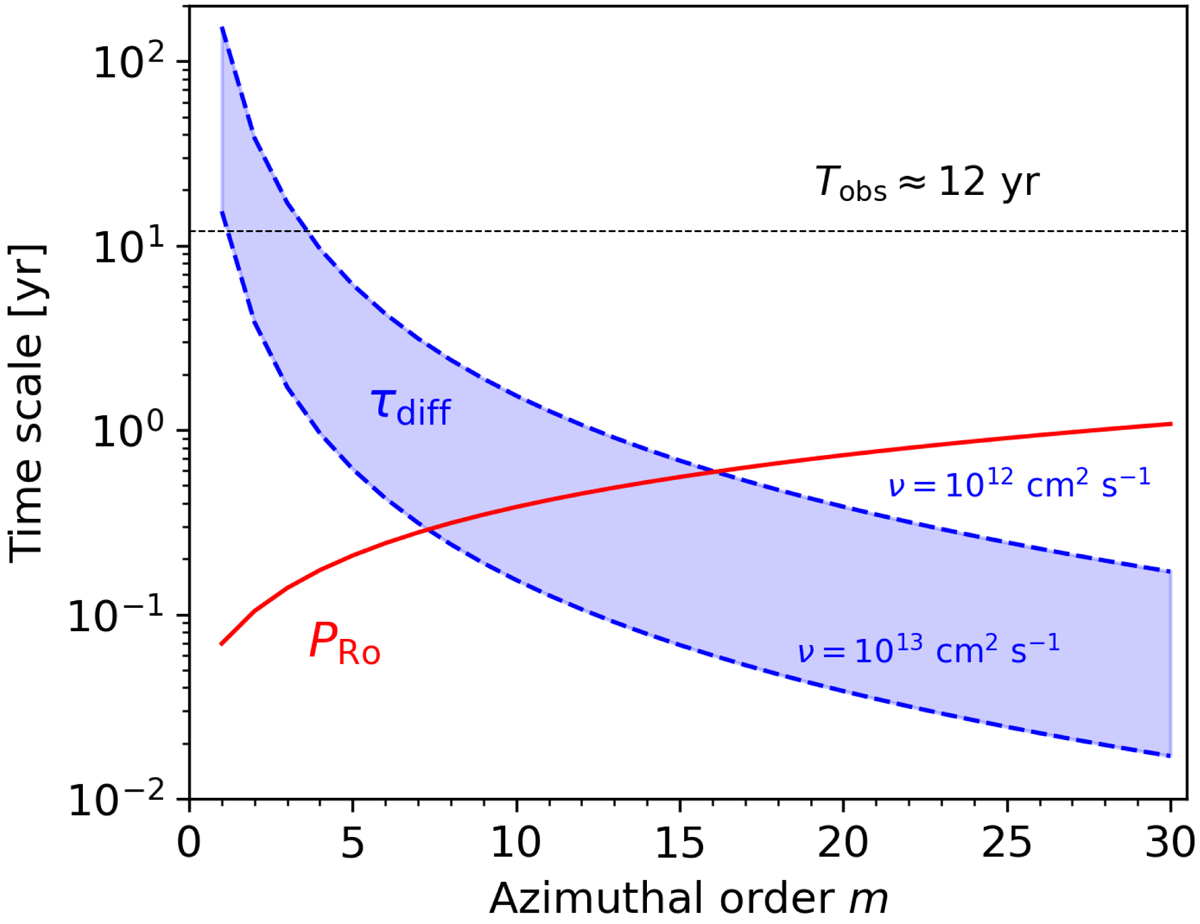
Fig. 13.
Download original image
Comparison between the oscillation periods of Rossby modes PRo and the diffusive timescale, τdiff, for two representative values of turbulent diffusivities of ν = 1012 and 1013 cm2 s−1. The horizontal black dashed line represents the length of the SDO/HMI observational record of Tobs ≈ 12 years.
Current usage metrics show cumulative count of Article Views (full-text article views including HTML views, PDF and ePub downloads, according to the available data) and Abstracts Views on Vision4Press platform.
Data correspond to usage on the plateform after 2015. The current usage metrics is available 48-96 hours after online publication and is updated daily on week days.
Initial download of the metrics may take a while.