Fig. 3.
Download original image
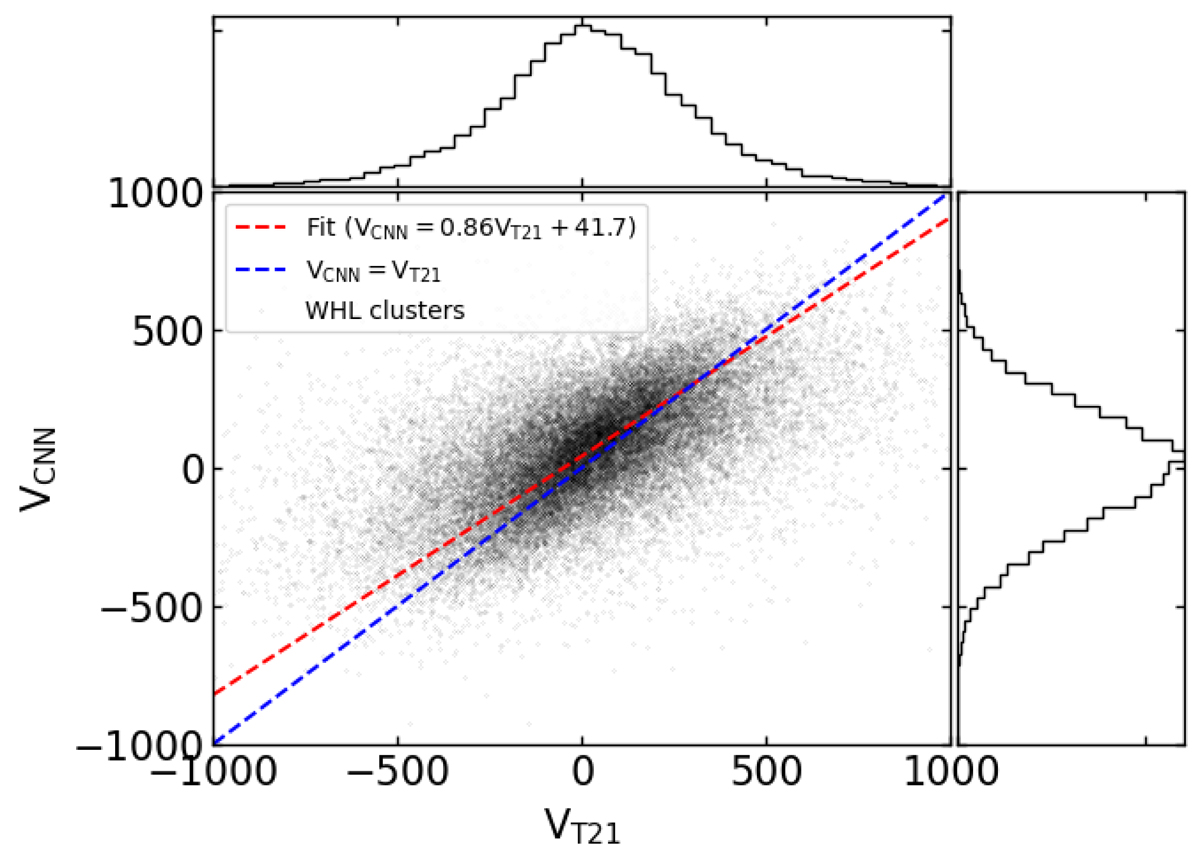
Estimated LOS velocities of the WHL galaxy clusters with our machine-learning approach and the method in T21. The projected distributions along the X-axis and Y-axis are shown in the top and right panels. In addition, the result of the linear fit is shown between the two approaches as the red dashed line, which is compared to the case where they are equal, which is shown by the blue dashed line.
Current usage metrics show cumulative count of Article Views (full-text article views including HTML views, PDF and ePub downloads, according to the available data) and Abstracts Views on Vision4Press platform.
Data correspond to usage on the plateform after 2015. The current usage metrics is available 48-96 hours after online publication and is updated daily on week days.
Initial download of the metrics may take a while.