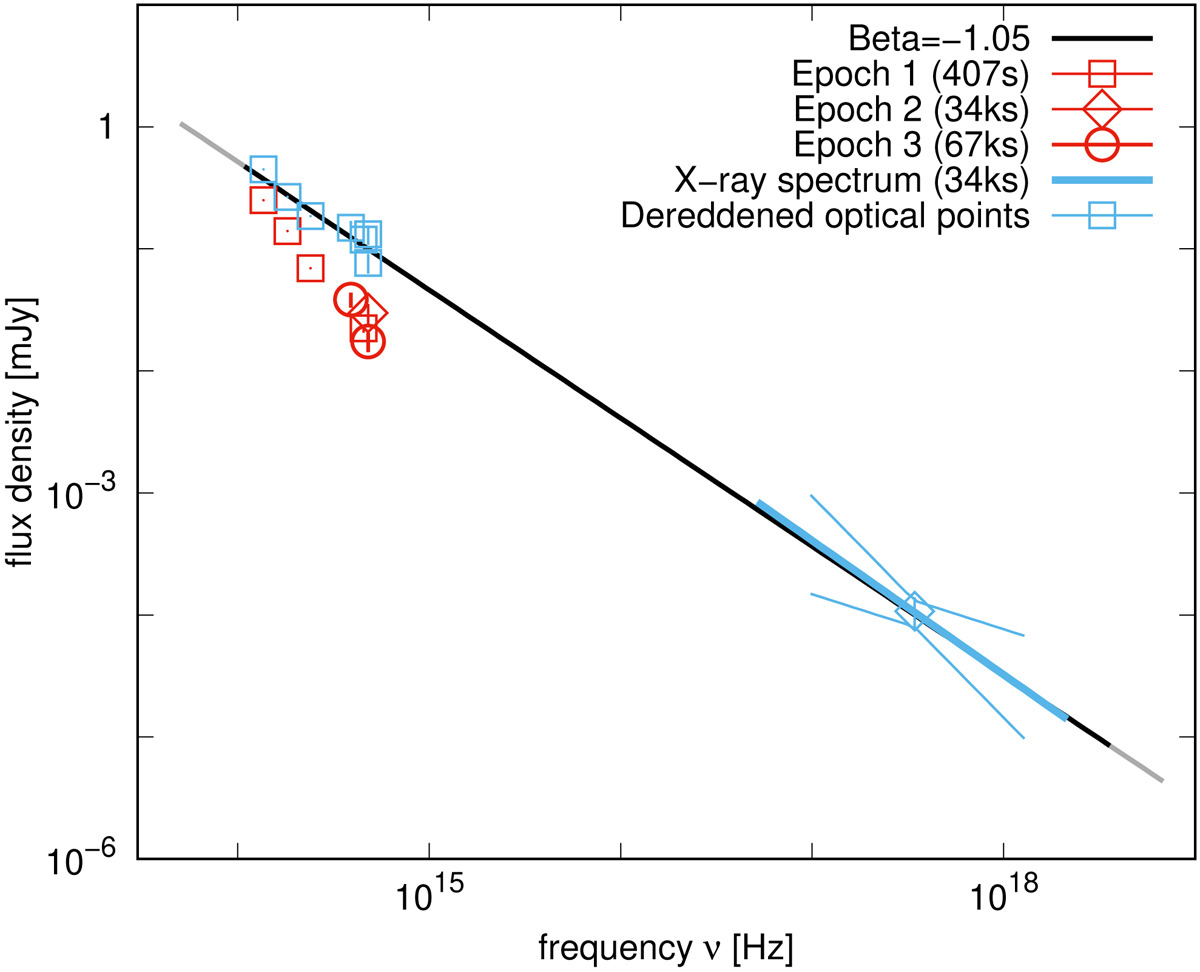
Fig. 7.
Download original image
Spectral energy distribution (SED) of GRB 190919B afterglow. Three different epochs were collapsed to provide the most comprehensive image available. The optical points were scaled so that they would represent the afterglow at 34 ks after the trigger. All observations are in agreement with a spectral slope of β = 1.05 derived from a fitted late-decay rate. X-ray point to the right is displayed together with its respective spectral slope and including the slope uncertainty (hence the butterfly). Frequencies are in the observer frame, the optical flux of the afterglow was corrected for Galactic extinction, as was the X-ray spectrum for interstellar hydrogen absorption. The blue optical and infreared points were also corrected for host galaxy dust absorption of E(B − V)=0.28.
Current usage metrics show cumulative count of Article Views (full-text article views including HTML views, PDF and ePub downloads, according to the available data) and Abstracts Views on Vision4Press platform.
Data correspond to usage on the plateform after 2015. The current usage metrics is available 48-96 hours after online publication and is updated daily on week days.
Initial download of the metrics may take a while.