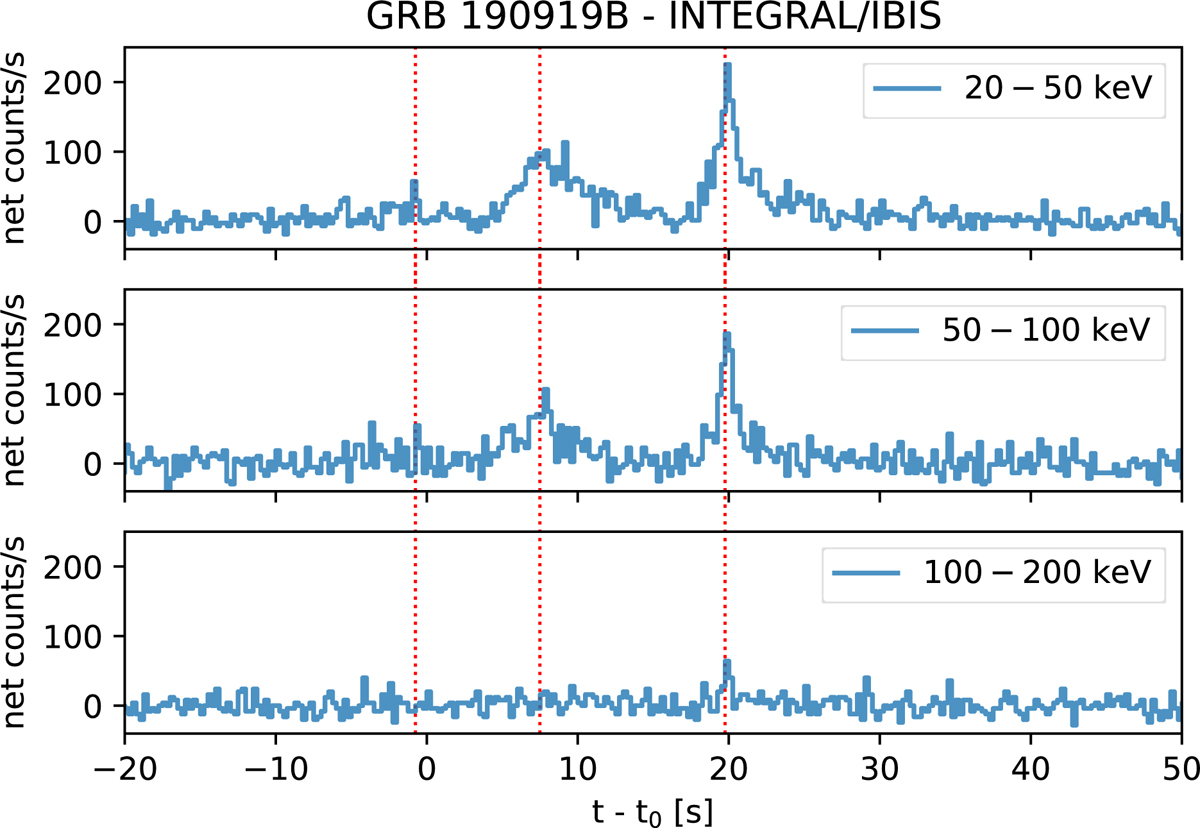
Fig. 1.
Download original image
INTEGRAL/ISGRI 20−50 keV and 50−150 keV light curves of GRB 190919B. The vertical lines depict the times of individual flare maxima in the high energy range. The hard energy excess is detected during the second main flare at (t − t0)∼20 s in the 100–200 keV energy range.
Current usage metrics show cumulative count of Article Views (full-text article views including HTML views, PDF and ePub downloads, according to the available data) and Abstracts Views on Vision4Press platform.
Data correspond to usage on the plateform after 2015. The current usage metrics is available 48-96 hours after online publication and is updated daily on week days.
Initial download of the metrics may take a while.