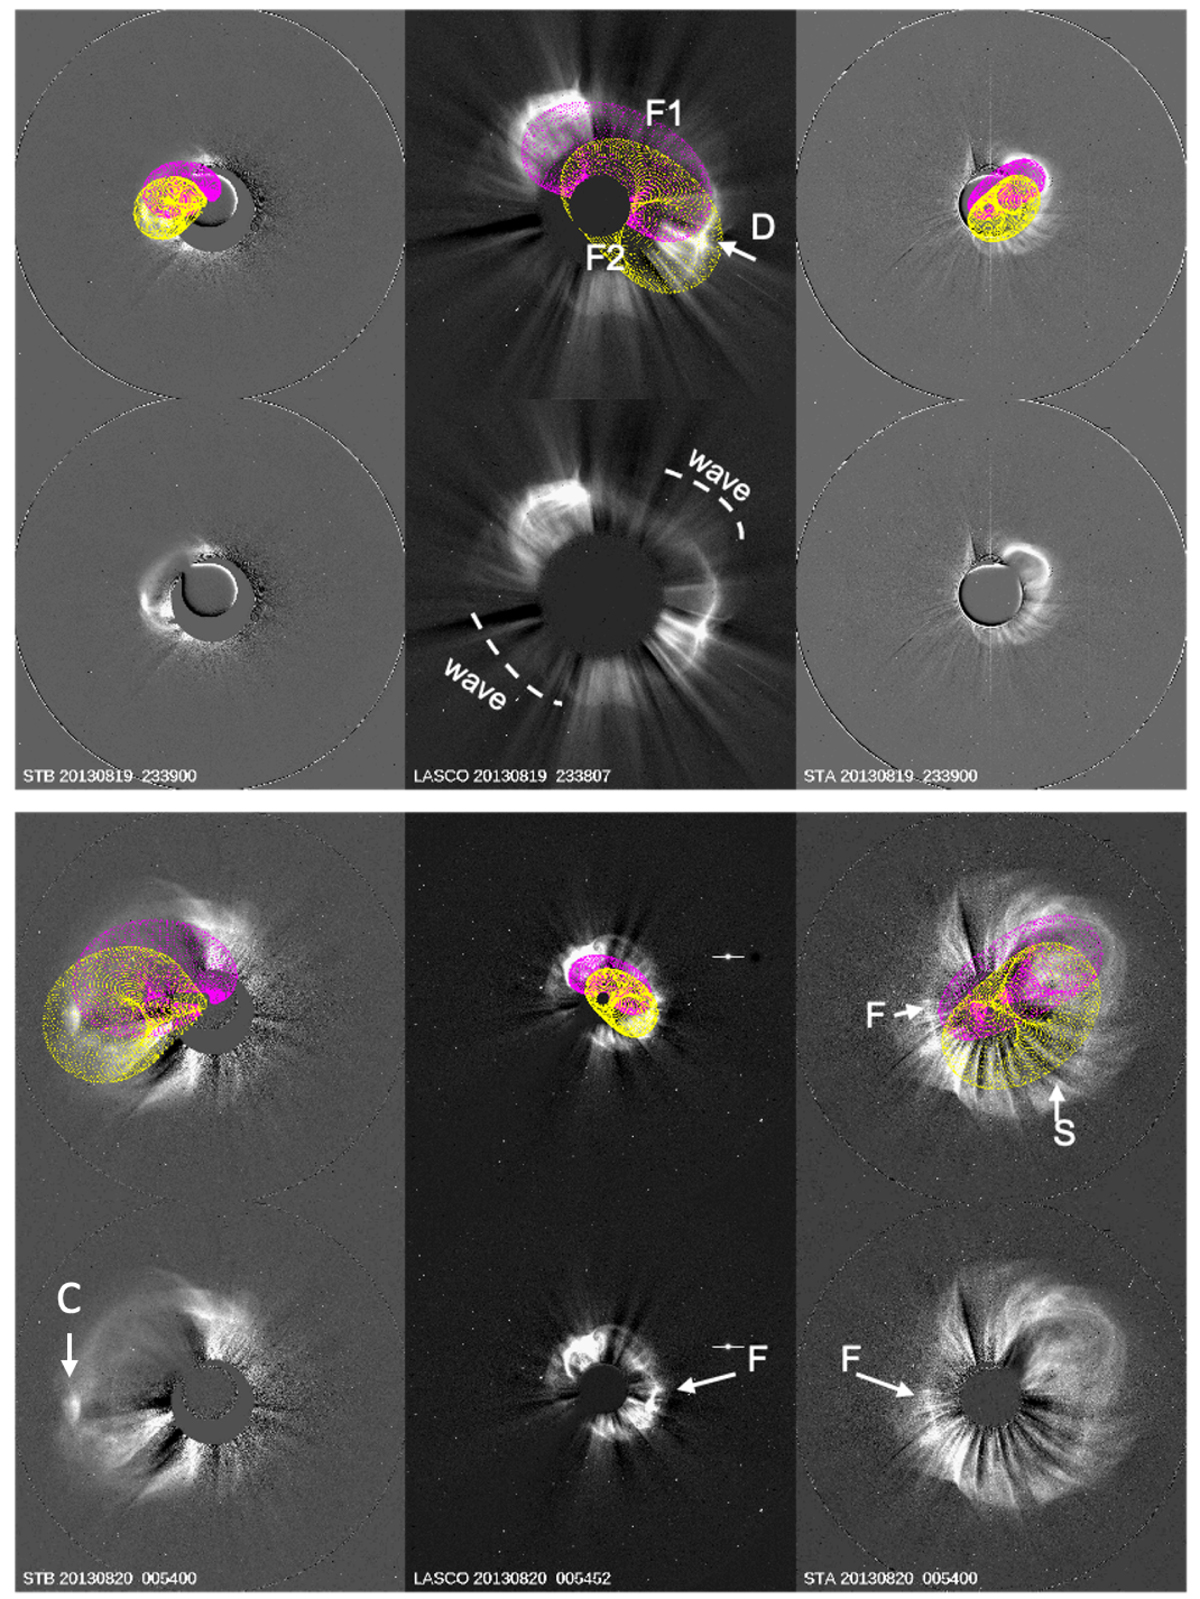
Fig. 6.
Download original image
Three-dimensional reconstruction of the CME MFR. Only the fits at two instances are shown. A single MFR is fitted with two GCS models (F1 and F2) to account for the curvature of the MFR axis, as indicated by the EUV observations. The extent of the CME-driven shock (or wave) is indicated in the top panel. “D” points to a dimple at the MFR front and “F” to the development of a flank at the north of the dimple. “S” points to an area where the F1–F2 GCS fits fail. Pileup feature “C” indicates a distorted region of the MFR. These features are discussed in detail in the text.
Current usage metrics show cumulative count of Article Views (full-text article views including HTML views, PDF and ePub downloads, according to the available data) and Abstracts Views on Vision4Press platform.
Data correspond to usage on the plateform after 2015. The current usage metrics is available 48-96 hours after online publication and is updated daily on week days.
Initial download of the metrics may take a while.