Fig. 5.
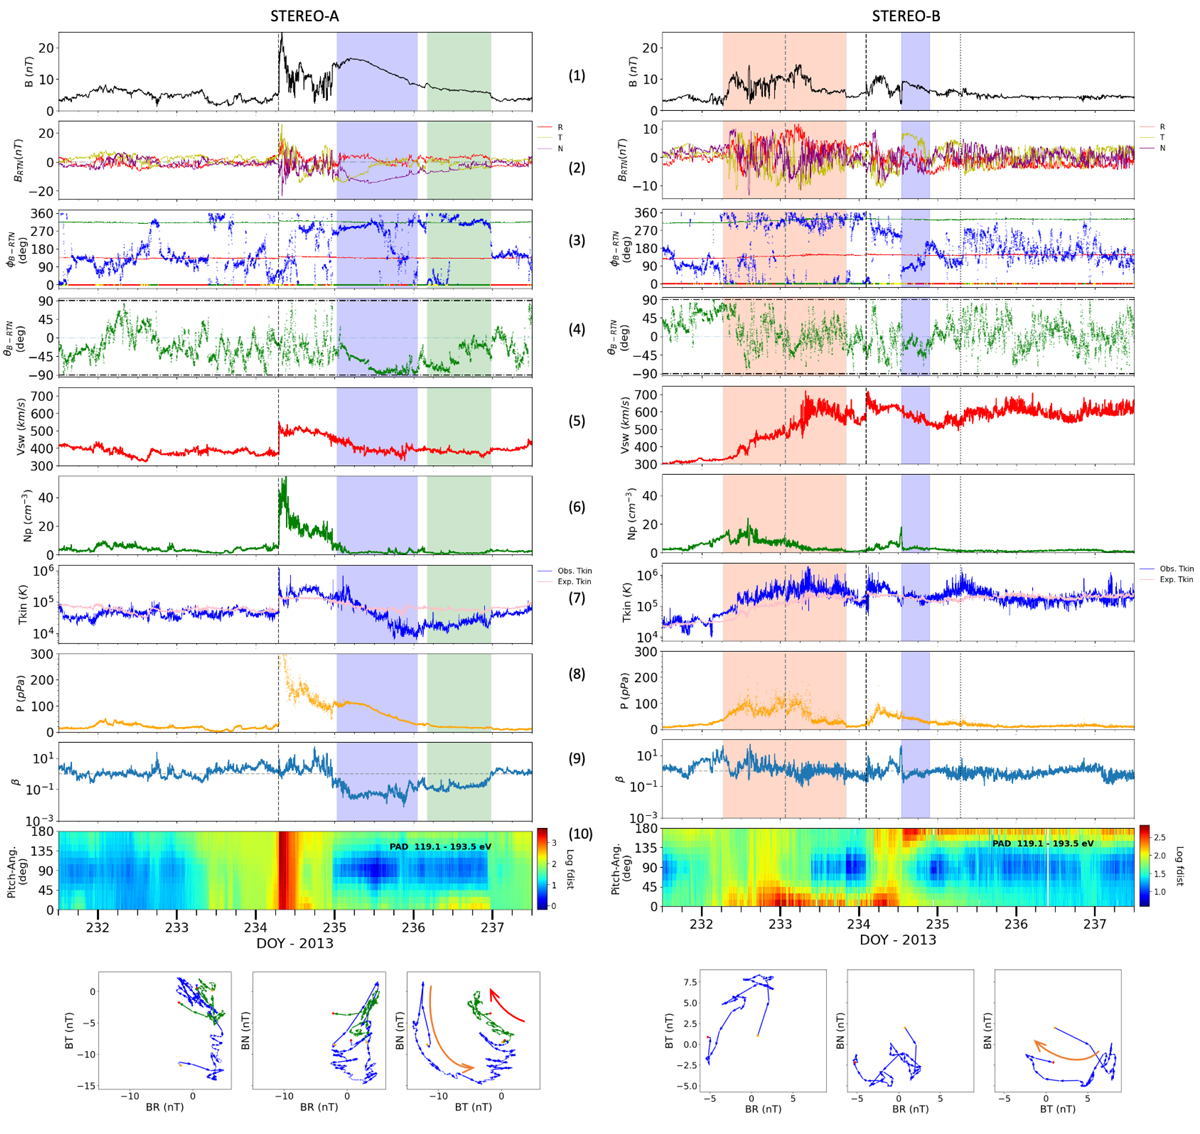
Download original image
In situ plasma and magnetic field observations by STEREO-A (left) and STEREO-B (right). Top: shown from top to bottom are the magnetic field magnitude, the magnetic field (BRTN) components, the magnetic field azimuthal and latitudinal angles (ϕB-RTN and θB-RTN), the one-minute-averaged solar wind speed, the proton density, the observed and the expected proton temperature, the total pressure (e.g. Russell et al. 2005), where the total plasma pressure is estimated based on Mullan & Smith (2006), the plasma β, and the suprathermal (119–193 eV) electron intensity pitch-angle distribution, where the pitch angles are defined relative to the local magnetic field direction. The lines and bands in panels (3) are the same as in Fig. 4. The pink line shown in panels (7), corresponds to the expected kinetic temperature for ambient solar wind, calculated as explained in Elliott et al. (2012). Interplanetary shock transits, MCs, and MC-like structures are respectively indicated with dashed black lines and blue and green shaded areas. An SIR is marked by the salmon shaded area based on the referenced catalogue. Bottom: Hodogram of the magnetic field components as in Fig. 4.
Current usage metrics show cumulative count of Article Views (full-text article views including HTML views, PDF and ePub downloads, according to the available data) and Abstracts Views on Vision4Press platform.
Data correspond to usage on the plateform after 2015. The current usage metrics is available 48-96 hours after online publication and is updated daily on week days.
Initial download of the metrics may take a while.