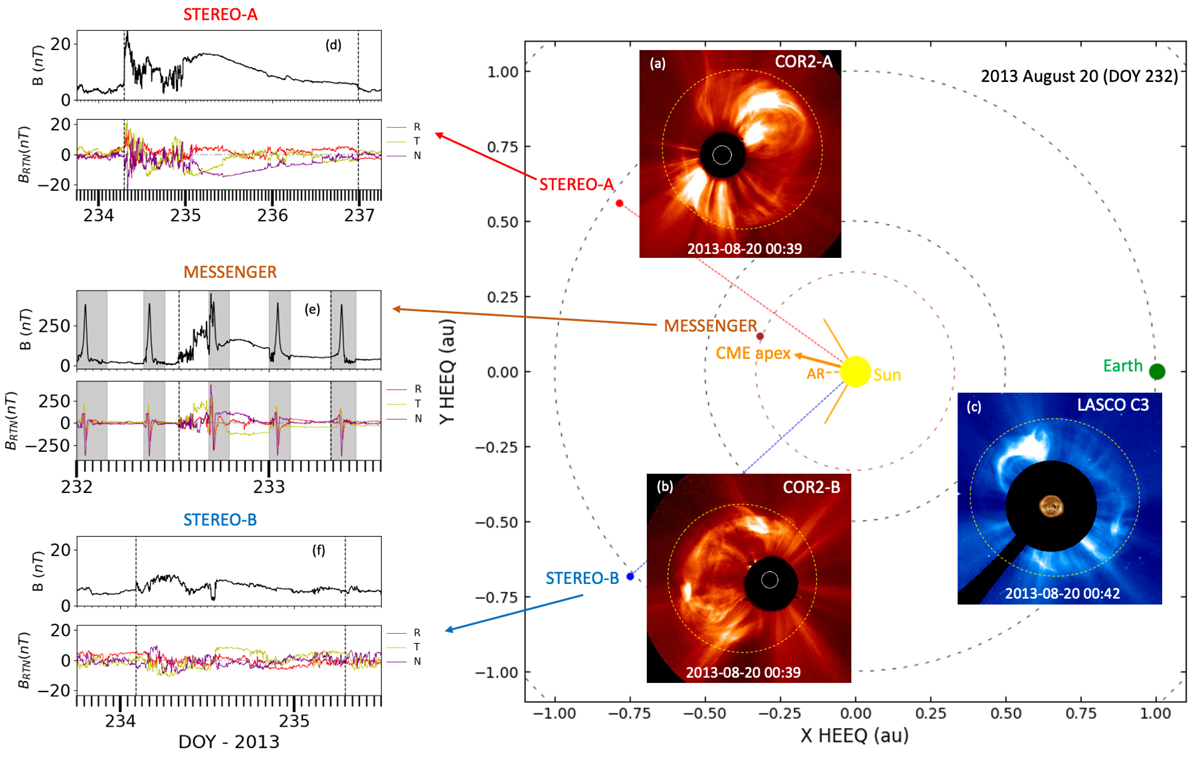
Fig. 1.
Download original image
Remote-sensing observations and in situ measurements of the 2013 August 19 CME. Right: view from the north heliographic pole, showing the positions of STEREO-A (W144), MESSENGER (W159), STEREO-B (E138), and the Earth on 2013 August 20 (DOY 232) in HEEQ coordinates. The yellow circle at the centre represents the Sun (not to scale). The dashed orange line marks the AR longitude. The orange arrow indicates the longitude of the CME apex direction (W165), and the orange lines (W121, E120) outline the width of the CME, as derived from the GCS model. The dashed black circles correspond to heliocentric distances of 0.5 R⊙ and 1 R⊙, respectively, while the brown circle corresponds to the heliocentric distance of MESSENGER (0.33 au). The inserted pictures show the coronagraph images as seen by COR2-A (a), COR2-B (b), and C3 (c); the images have been magnified for a better visualization. The dashed yellow curves roughly outline the CME-driven shock. Left: solar wind magnetic field measured by STEREO-A (d), MESSENGER (e), and STEREO-B (f). Top panels: magnetic field strength, and bottom panels: magnetic field BRTN components, where RTN corresponds to the radial-tangential-normal coordinate system (e.g. Hapgood 1992). The dashed vertical lines mark the start and end of the ICME.
Current usage metrics show cumulative count of Article Views (full-text article views including HTML views, PDF and ePub downloads, according to the available data) and Abstracts Views on Vision4Press platform.
Data correspond to usage on the plateform after 2015. The current usage metrics is available 48-96 hours after online publication and is updated daily on week days.
Initial download of the metrics may take a while.